|
 |
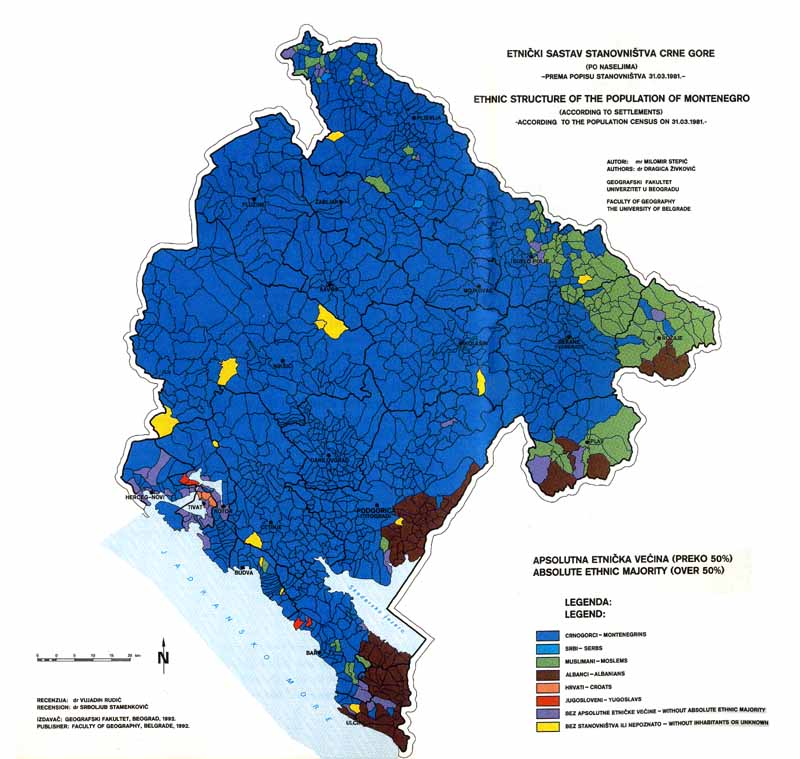
Vujadin RudićThe Ethnic Structure of the Population in MontenegroSource: The Serbian Questions in The Balkans, University of Belgrade, publisher - Faculty of Geography, Belgrade 1995.
The Republic of Montenegro is situated in the south-west of the Balkan peninsula. It is located among Albania, Serbia, Bosnia, Herzegovina, Croatia, and the Adriatic Sea. It covers the area of 13,812 sq. km and in 1991 the population living in this area numbered 615,447. The average population per one sq. km is 44.55 inhabitants. Population density varies due to natural and socio-economic factors. The highest population density is recorded in the coastal municipalities (Tivat 247.91, Herceg Novi 117.40, Ulcinj 96.00, Budva 95.98, Bar 73.92, and Podgorica 108.85 inhabitants per one sq. km.) and the lowest in the mountainous regions (Plužine 6.34, Šavnik 6.68, Žabljak 11.00, and Kolašin 12.37 inh. per one sq. km.). The population of Montenegro is increasing, especially in the municipalities of Nikšić, Podgorica, Mojkovac, Herceg Novi, and Tivat. Montenegro has a very favourable geographical location thanks to its exit to the Adriatic Sea, to the railway line from Belgrade to Bar, to the Adriatic Highway, and a number of asphalt-paved roads passing through its territory. The exit to the Adriatic Sea and afore-mentioned communications link Montenegro with the Mediterranean basin, Eastern and Western Europe. The Republic of Montenegro has an outstanding geostrategic position owing to its location in the Mediterranean and the continental Europe. This position is particularly important in the times of disturbed international relationships in this part of Europe and in the world. The interests of the three large groups of nations: Slavic, Romanic, and Germanic and three major religions - Orthodox, Muslim, and Catholic are intersected in this region. These interests breed unrest among the population of different confessions, particularly in the northern, north-east, eastern, and southern parts of the Republic. It should be pointed out that Croatia and Albania have some aspirations to the territory of Montenegro. The Islamized Serbian population create political instability which is utterly expressed in the times of wars and disturbed relationships among the states and nations in this region The Shqiptars/Albanians/ in Montenegro-are under the influence of Tirana, the Croats under the influence of Zagreb and the Vatican, and the Muslims under the influence of Istanbul, Teheran, Cairo, Sarajevo, and other Islamic centres. It is important to emphasise that the separation of the two Serbian states Serbia and Montenegro has been planned for a long period of time. It was fully expressed at the Berlin Congress in 1878 when the Sanjak Novi Pazar was constituted (the Sanjak was constituted to divide Serbia and Montenegro and link Bosnia with Kosovo, Metohia, and Turkey) and after World War II. This matter was fervently pursued by the leaders of the League of Communists of Yugoslavia and the state authorities of the Socialist Federal Republic of Yugoslavia, and such policy led to the disintegration of Yugoslavia. Although the Montenegrin area is not very spacious, the ethnic structure of the Republic is very heterogeneous and burdened with ethnic and confessional problems. This is especially evident in the regions bordering on Albania, Serbia, Pljevlja and Boka Kotorska (Bay of Kotor). Due to the intricacy of historical circumstances and the wrong policy conducted after World War II, the population of different confessions in some social, economic, cultural and political circumstances declared themselves as members of different peoples though their ethnic roots were the same. In the census after World War II the Serbian population of the Muslim confession declared themselves as Serbs, Montenegrins, Turks, undecided Muslims, undecided Yugoslavs, Yugoslavs, Muslims - ethnic affiliation, while in the 1971, 1981, and 1991 censuses they declared themselves as Muslims in a sense of people. This is the classical example of a forcible division of a nation through religion and ideology If in specific social and economic, cultural and political circumstances, a population declare themselves differently it is evident proof of the lack of ethnic identity. This is a unique example in the world that the confessional and ethnic affiliations are regarded as identical In the world, the term 'Muslim' defines a person belonging to the Muslim religion and has no relation to ethnic origin whatsoever. In Montenegro and Serbia a portion of the population of Orthodox confession sometimes declared themselves as the Serbs and sometimes as the Montenegrins although they belonged to the same people - the Serbian. Today the Serbian people in this area is divided into three nations: the Serbs (living in Serbia and fewer in Montenegro), the Montenegrins (the Serbs who live in Montenegro and fewer in Serbia), and the Muslims (Islamized Serbs living in Serbia and in Montenegro). Various means and methods were used in order to divide the Serbs: economic, cultural, linguistic, territorial, and, in particular, religious, ideological and chauvinistic. That was how the 'separate peoples' such as Montenegrins, Muslims, Macedonians, and Yugoslavs emerged from the Serbian ethnic entity (in nationally mixed regions, the Serbs often declared themselves as Yugoslavs, particularly so in Herzegovina, Bosnia, and Croatia). Today (as well as earlier) it is clear to everybody that the people who come from the towns of Vranje, Leskovac, and Niš differ from the people of Šumadija more than the Montenegrins do, but they do not even think of becoming a separate people. It should be noted that there are differences between the Serbs in Montenegro and those in Serbia, but they are insufficient to determine them as separate peoples. The Montenegrins are the mainstay of the Serbian ethnic being and Montenegro as a state has been its guardian throughout the centuries. It is not necessary to emphasise that the Montenegrins are an integral part of the Serbian people since the literature, especially that of the period before World War II, contains numerous facts. Many outstanding men of science and culture wrote about the Montenegrins as Serbs, for example, Petar I Petrović Njegoš (1747-1830), Petar II Petrović Njegoš (1813-1851), Stefan Mitrov Ljubiša (1824-1878), Marko Miljanov Popović (1833-1901), Nikola I Petrović Njegoš (1841-1921), Jovan Cvijić (1865-1927), Jovan Erdeljanović (1874-1944) as well as our contemporaries Matija Bećković, Batrić Jovanović, Nikola Vukčević and many others. One should also keep in mind those who have a different opinion concerning the origin and ethnogenesis of the Montenegrins. In his letter to the Bjelice clan saying: "In the times when God united the Serbian people to free itself from Turkish slavery...", Petar I Petrović Njegoš appeals to the Montenegrins to be "...just as other honest Serbian heroes who have freed themselves and hurried to help the other Serbs to gain their freedom." About the Serbian origin of the famous Montenegrin hero, a character from the Mountain Wreath, Petar II Petrović Njegoš says: "Mićunović talks and labours! / no Serbian mother has yet given birth to such one/ neither after the Kosovo, nor before."[1] The writer Stefan Mitrov Ljubiša, writing about Šćepan Mali, comments on Djurdje Crnojević's marriage: "...we, the Serbs, lose our heads...". He also mentions that the old towns of Haj and Nehaj on the Montenegrin Coast are Serbian.[2] Then, he points out that "...if bad luck has thinned the Serbs in your village, it has not, thank God, done so in Zeta and the rest of the world."[3] The work of Marko Miljanov brims with arguments that the Montenegrins are Serbs and he particularly points this out in his letters to eminent men and friends. The Montenegrin King Nikola I Petrović Njegoš spoke of the importance of the Balkan wars and the unification of the newly liberated parts with Montenegro and said that it was a deed of "...the brave armies of two Serbian Kingdoms - Montenegro and Serbia..."[4] which means that he considered the Montenegrins to be Serbs. Writing about the "patriarchal system" in Montenegro and in the neighbouring Albania, Jovan Cvijić says that "The Serbs and Albanians still retain the concept of clan, brotherhood, family, clan-system organization and of blood feud."[5] This proves that he viewed the Montenegrins as Serbs, which was the unifying idea in his whole work on anthropogeography of this area. Of the same opinion were also other scientists who dealt with the historiographic, ethnological, and anthropogeographical aspects of the population of Montenegro. A scientific contribution of great value concerning this problem was given by Jovan Erdeljanović in his work "Some Features of Clan Organisation in the Dinaric Serbs". In all his work he considers all the Montenegrins as Serbs, and he could not think it otherwise for they are Serbs and they feel like Serbs. The most systematic survey of the papers dealing with the ethnic origin of the Montenegrins was given by Nikola Vukčević in his book Ethnic Origin of the Montenegrins, and Batrić Jovanović in his book The Montenegrins about Themselves. It is sufficient to read either of them and get a clear picture of the ethnic origin of the Montenegrins. But, if the reader wants to find out for himself, he should pay a visit to Montenegrin villages. Among those whose literary work shows that the Montenegrins are Serbs is Matija Bećković, the member of SANU, born in Rovci near Kolašin, "...the witty prince of the Serbian poetry..." as it is pointed out by Borislav Mihajlović in the foreword to the Poems.[6] In the 1948 and 1953 censuses the ethnic structure of the population of Montenegro was shown by administrative districts, and in the 1961, 1971, 1981, and 1991 censuses by municipalities. No comparison of the 1948 and 1953 data with the data given in later censuses is possible for two main reasons: territorial and socio-economic together with the political one. The territories of the former districts do not coincide with the territories of the present municipalities. In 1948 Montenegro was divided into 13 districts, in 1953 into 10 of them. Later, Montenegro was divided into 20 municipalities. Socio-economic and political conditions kept changing after the Second World War and these changes influenced the ethnic determination of the population. In the 1948 and 1953 censuses a vast majority of the Serbs of the Muslim confession declared themselves as Montenegrins, in 1961 as Muslims - ethnic affiliation, and in the 1971, 1981, and 1991 censuses as the Muslims, in the sense of separate nation. Table 1 Ethnic Structure of the Population of
Montenegro.
|
||||||||||||||||||||||||||||||||||||||||||||||||||||||||||||||||||||||||||||||||||||||||||||||||||||||||||||||||||||||||||||||||||||||||||||||||||||||||||||||||||||||||||||||||||||||||||||||||||||||||||||||||||||||||||||||||||||||||||||||||||||||||||||||||||||||||||||||||||||||||||||||||||||||||||||||||||||||||||||||||||||||||||||||||||||||||||||||||||||||||||||||||||||||||||||||||||||||||||||||||||||||||||||||||||||||||||||||||||||||||||||||||||||||||||||||||||||||||||||||||||||||||||||||||||||||||||||||||||||||||||||||||||||||||||||||||||||||||||||||||||||||||||||||||||||||||||||||||||||||||||||||||||||||||||||||||||||||||||||||||||||||||||||||||||||||||||||||||||||||||||||||||||||||||||||||||||||||||||||||||||||||||||||||||||||||||||||||||||||||||||||||||||||||||||||||||||||||||||||||||||||||||||||||||||||||||||||||||||||||||||||||||||||||||||||||||||||||||||||||||||||||||||||||||||||||||||||||||||||||||||||||||||||||||||||||||||||||||||||||||||||||||||||||||||||||||||||||||||||||
|
Year |
1948 |
1953 |
||
|
Total |
377,189 |
|
419,873 |
|
|
Montenegrins |
342,009 |
90.67 |
363,686 |
86.61 |
|
Serbs |
6,707 |
1.77 |
13,864 |
3.30 |
|
Croats |
6,801 |
1.80 |
9,814 |
2.33 |
|
Undecided Muslims |
387 |
0.10 |
- |
- |
|
Yugoslavs undecided |
- |
- |
6,424 |
1.52 |
|
Shqiptars |
19,425 |
5.14 |
23,460 |
5.58 |
|
Other, unknown |
1,860 |
0.52 |
2,625 |
0.66 |
According to the 1948 census the main features of the ethnic structure of the population of Montenegro are as follows: in nine districts 90% of the population were the Montenegrins (Durmitor 99.86%, Kolašin 99.26%, Danilovgrad 98.83%, Pljevlja 98.78%, Bijelo Polje 98.75%, Berane 98.42%, Cetinje 97.83%, Nikšić 96.89%, and Andrijevica 91.54%); the highest share of the Serbs in the total population was in the district of Herceg Novi (18.59%) and Kotor (6.05%) and the lowest share in the district of Danilovgrad (0.21%), Kolašin (0.24%), and Andrijevica (0.27%); the maximum share of the Croats was in the district of Kotor (25.94%) and Herceg Novi (8.39%) and the minimum in Bijelo Polje (0.03%), Durmitor (0.04%), and Berane (0.05%); the highest number of the Shqiptar minority was in the district of Berane (28.84%), Podgorica (13.95%), and Andrijevica (7.87%) (there were no Shqiptar national minority in four districts: Bijelo Polje, Durmitor, Herceg Novi and Kolašin); a small number of the Muslim population declared themselves as "undecided Muslims", and there was a small number of the members of other peoples and ethnic groups, only 1860: Slovenes 484, Germans 375, Russians 277, Italians 162, Romanies 162, Macedonians 133, Czechs 93, Hungarians 62, etc.
According to the 1953 census the main features of the ethnic structure of the population of Montenegro are as follows: in seven districts over 90% of the population were Montenegrins (Durmitor 99.39%, Kolašin 98.91%, Cetinje 98%, Nikšić 95.89%, Bijelo Polje 95.51%, Pljevlja 91.41%, and Berane 90.88%); the highest share of the Serbs was in the districts of Boka Kotorska (23.40%) and Bar (3.08%) and the least in the districts of Durmitor and Berane (0.50%); the highest number of the Croats was in the districts of Boka Kotorska (22.26%) and Bar (1.01%), and the least in the districts of Durmitor (0.02%) and Berane (0.07%); the highest number of the members of the Shqiptar minority was in the districts of Bar (31.16%), Podgorica (10.31%), and Berane (5.04%), and the lowest share in the districts of Bijelo Polje (0.00%), Kolašin (0.01%), Cetinje and Pljevlja (0.07%), the share of "undecided Yugoslavs" was at its highest in the districts of Pljevlja (5.87%), Bijelo Polje (3.26%) and Berane (3.01%) and the least in the districts of Durmitor (0.03%) Kolašin (0.07%), and Cetinje (0.14%). The highest share of the members of other peoples and ethnic groups occurred in the districts of Boka Kotorska (1.99%), Nikšić (1.10%) and the least in the districts of Durmitor (0.04%), Kolašin (0.29%), and Pljevlja (0.40%).
A comparison of the 1948 and 1953 census data by districts is not possible because of the territorial reorganisation of Montenegro which took place in the meantime. Still, socio-economic, political, social, and other circumstances are the same and it is thus possible to conduct an analysis of the ethnic structure of the population for the whole of Montenegro based on the two census data. In the period 1948 - 1953 the population of Montenegro increased in number by 11.31% largely due to the high rate of natural population increase which was stopped or reduced to its lowest during World War II. The number of Montenegrins increased by 6.33%, the Serbs by 106.70%. The low percentage of increase for the Montenegrins was due to the fact that the members of other nationalities did not declare themselves as Montenegrins but as Serbs, Croats, "undecided Yugoslav", and other. The percentage of the Serbs was increased by 106,70%, of the Croats by 44.30%, and of other peoples and ethnic groups by 41.12%. The absolute number of the members of the Shqiptar national minority was increased due to the high race of natural population increase which is still characteristic of this minority. In the period 1948 to 1953 the number of the Shqiptar national minority was increased by 20.77%. In the period after the Second World War the members of other peoples in Montenegro increased in relation to the Montenegrins. This has been fully expressed in the course of the last thirty years.
|
|
1961 |
1971 |
1981 |
1991 |
||||
|
Municipality of Ulcinj |
||||||||
|
Total |
16,213 |
|
18,955 |
|
21,576 |
|
24,482 |
|
|
Montenegrins |
5,600 |
34.54 |
3,442 |
18.15 |
3,346 |
15.50 |
3,028 |
|
|
Serbs |
91 |
0.56 |
223 |
1.17 |
241 |
1.11 |
421 |
|
|
Muslims |
19 |
0.11 |
687 |
3.62 |
710 |
3.29 |
1,124 |
|
|
Shqiptars /Albanians/ |
10,390 |
64.08 |
13,706 |
72.30 |
15,663 |
72.59 |
17,652 |
|
|
|
|
|
|
|
|
|
|
|
|
Croats |
55 |
0.33 |
70 |
0.36 |
61 |
0.28 |
44 |
0.17 |
|
Yugoslavs |
17 |
0.10 |
522 |
2.75 |
1,150 |
5.32 |
1,134 |
4.63 |
|
Other |
41 |
0.28 |
305 |
1.65 |
405 |
1.91 |
1,079 |
4.44 |
|
Municipality of Bar |
||||||||
|
Total |
24,587 |
|
27,580 |
|
32,535 |
|
37,331 |
|
|
Montenegrins |
21,844 |
88.87 |
17,769 |
64.42 |
20,899 |
64.23 |
18,989 |
50.86 |
|
Serbs |
387 |
1.61 |
1,208 |
4.37 |
1,263 |
3.88 |
3,597 |
9.63 |
|
Muslims |
10 |
0.04 |
2,701 |
9.79 |
2,242 |
6.89 |
5,178 |
13.87 |
|
Shqiptars /Albanians/ |
1,919 |
7.80 |
4,273 |
15.49 |
4,109 |
12.62 |
4,672 |
12.51 |
|
Croats |
266 |
1.08 |
273 |
0.98 |
231 |
0.71 |
191 |
0.51 |
|
Yugoslavs |
46 |
0.18 |
955 |
3,46 |
3,054 |
9.38 |
2,719 |
7.28 |
|
Other |
115 |
0.42 |
401 |
1.49 |
737 |
2.29 |
1,985 |
5.34 |
|
Municipality of Budva |
||||||||
|
Total |
4,974 |
|
6,106 |
|
8,632 |
|
11,710 |
|
|
Montenegrins |
4,267 |
88.27 |
3,953 |
64.73 |
6,022 |
69.76 |
7,318 |
62.49 |
|
Serbs |
285 |
5.89 |
1,469 |
24.05 |
899 |
10.41 |
2,631 |
22.46 |
|
Muslims |
19 |
0.39 |
30 |
0.49 |
70 |
0.81 |
176 |
1.50 |
|
Shqiptars /Albanians/ |
10 |
0.20 |
26 |
0.42 |
37 |
0.42 |
74 |
0.63 |
|
Croats |
185 |
3.82 |
136 |
2.22 |
121 |
1.40 |
134 |
1.14 |
|
Yugoslavs |
6 |
0.12 |
285 |
4.63 |
1,272 |
14.73 |
1,006 |
8.59 |
|
Other |
62 |
1.31 |
207 |
3.46 |
211 |
2.47 |
371 |
3.19 |
|
Municipality of Tivat |
||||||||
|
Total |
5,974 |
|
6,925 |
|
9,315 |
|
11,404 |
|
|
Montenegrins |
1,426 |
23.87 |
1,647 |
23.78 |
2,831 |
30.39 |
3,809 |
33.40 |
|
Serbs |
863 |
14.44 |
971 |
14.02 |
850 |
9.12 |
1,724 |
15.11 |
|
Muslims |
6 |
0.10 |
41 |
0.59 |
41 |
0.44 |
219 |
1.92 |
|
Shqiptars /Albanians/ |
9 |
0.15 |
32 |
0.46 |
129 |
1.38 |
158 |
1.38 |
|
Croats |
3,423 |
57.29 |
3,375 |
48.73 |
2,876 |
30.87 |
2,663 |
23.35 |
|
Yugoslavs |
75 |
1.25 |
634 |
9.15 |
2,384 |
25.59 |
2,346 |
20.57 |
|
Other |
172 |
2.90 |
226 |
3.27 |
204 |
2.21 |
485 |
4.27 |
|
Municipality of Kotor |
||||||||
|
Total |
16,642 |
|
18,917 |
|
20,455 |
|
22,437 |
|
|
Montenegrins |
10,806 |
64.93 |
10,134 |
53.57 |
11,205 |
54.77 |
12,364 |
55.10 |
|
Serbs |
1,788 |
10.74 |
3,362 |
17.77 |
1,703 |
8.32 |
3,166 |
14.11 |
|
Muslims |
12 |
0.07 |
98 |
0.51 |
72 |
0.35 |
203 |
0.90 |
|
Shqiptars /Albanians/ |
39 |
0.23 |
70 |
0.37 |
59 |
0.28 |
60 |
0.26 |
|
Croats |
3,483 |
20.92 |
2,612 |
13.80 |
1,644 |
8.03 |
1,617 |
7.20 |
|
Yugoslavs |
274 |
1.64 |
2,171 |
11.47 |
5,271 |
25.76 |
4,147 |
18.48 |
|
Other |
240 |
1.47 |
470 |
2.51 |
501 |
2.49 |
880 |
3.95 |
|
Municipality of Herceg Novi |
||||||||
|
Total |
15,157 |
|
18,368 |
|
23,258 |
|
27,589 |
|
|
Montenegrins |
8,849 |
58.38 |
8,581 |
46.71 |
9,877 |
42.46 |
11,223 |
40.67 |
|
Serbs |
4,261 |
28.11 |
5,216 |
28.39 |
3,844 |
46.52 |
8,528 |
30.91 |
|
Muslims |
31 |
0.20 |
82 |
0.44 |
152 |
0.65 |
332 |
1.20 |
|
Shqiptars /Albanians/ |
67 |
0.44 |
83 |
0.45 |
83 |
0.35 |
103 |
0.37 |
|
Croats |
1,544 |
10.18 |
1,195 |
6.50 |
702 |
3.01 |
630 |
2.28 |
|
Yugoslavs |
102 |
0.67 |
2,553 |
13.89 |
8,006 |
34.42 |
5,257 |
19.05 |
|
Other |
303 |
2.02 |
658 |
3.62 |
594 |
2.59 |
1,516 |
5.52 |
|
Municipality of Podgorica |
||||||||
|
Total |
72,219 |
|
98,796 |
|
132290 |
|
152288 |
|
|
Montenegrins |
58,507 |
81.01 |
73,110 |
74.00 |
101482 |
76.71 |
110124 |
72.31 |
|
Serbs |
2,306 |
3.19 |
5,175 |
5.23 |
4,060 |
3.06 |
11,572 |
7.59 |
|
Muslims |
421 |
0.58 |
3,626 |
3.67 |
5,948 |
4.49 |
7,891 |
5.18 |
|
Shqiptars /Albanians/ |
9,250 |
12.80 |
12,156 |
12.30 |
12,122 |
9.16 |
12,951 |
8.50 |
|
Croats |
736 |
1.01 |
788 |
0.79 |
686 |
0.51 |
616 |
0.40 |
|
Gypsies/Romanies |
- |
- |
243 |
0.24 |
1,011 |
0.76 |
- |
- |
|
Yugoslavs |
186 |
0.25 |
1,846 |
1.86 |
5,192 |
3.92 |
4,884 |
3.20 |
|
Turks |
27 |
0.03 |
18 |
0.01 |
- |
- |
- |
- |
|
Other |
786 |
1.13 |
1,834 |
1.90 |
1,789 |
1.39 |
4,250 |
2.82 |
|
Municipality of Plav |
||||||||
|
Total |
18,913 |
|
19,542 |
|
19,560 |
|
19,313 |
|
|
Montenegrins |
14,890 |
78.72 |
5,246 |
26.84 |
4,583 |
23.43 |
3,499 |
18.11 |
|
Serbs |
65 |
0.34 |
584 |
2.98 |
90 |
0.46 |
271 |
1.40 |
|
Muslims |
673 |
3.55 |
9,401 |
48.10 |
10,153 |
51.90 |
11,220 |
58.09 |
|
Shqiptars /Albanians/ |
3,131 |
16.55 |
3,736 |
19.11 |
4,036 |
20.63 |
4,003 |
20.72 |
|
Croats |
19 |
0.10 |
37 |
0.18 |
20 |
0.10 |
2 |
0.01 |
|
Yugoslavs |
97 |
0.51 |
43 |
0.22 |
397 |
2.02 |
89 |
0.46 |
|
Turks |
16 |
0.08 |
24 |
0.12 |
- |
- |
- |
- |
|
Other |
22 |
0.15 |
471 |
2.45 |
281 |
1.46 |
229 |
1.21 |
|
Municipality of Berane |
||||||||
|
Total |
46,072 |
|
49,351 |
|
49,772 |
|
45,662 |
|
|
Montenegrins |
38,559 |
87.51 |
31,150 |
63.11 |
34,748 |
69.81 |
28,630 |
62.70 |
|
Serbs |
330 |
0.75 |
3,920 |
7.94 |
847 |
1.70 |
3,741 |
8.19 |
|
Muslims |
4,406 |
10.00 |
12,362 |
25.04 |
12,383 |
24.87 |
11,789 |
25.80 |
|
Shqiptars /Albanians/ |
41 |
0.09 |
87 |
0.17 |
35 |
0.07 |
50 |
0.10 |
|
Croats |
94 |
0.21 |
85 |
0.17 |
86 |
0.17 |
48 |
0.10 |
|
Yugoslavs |
97 |
0.22 |
467 |
0.94 |
1,099 |
2.20 |
784 |
1.76 |
|
Turks |
368 |
0.83 |
12 |
0.02 |
- |
- |
- |
- |
|
Other |
177 |
0.39 |
1,268 |
2.61 |
574 |
1,18 |
620 |
1.35 |
|
Municipality of Rožaje |
||||||||
|
Total |
14,700 |
|
16,018 |
|
20,227 |
|
22,877 |
|
|
Montenegrins |
5,428 |
36.92 |
2,082 |
13.00 |
1,900 |
9.39 |
1,429 |
6.25 |
|
Serbs |
76 |
0.51 |
189 |
1.17 |
159 |
0.78 |
159 |
0.70 |
|
Muslims |
8,009 |
54.48 |
12,483 |
77.93 |
16,975 |
83.96 |
20,044 |
87.62 |
|
Shqiptars /Albanians/ |
528 |
3.59 |
922 |
5.75 |
863 |
4.26 |
898 |
3.92 |
|
Croats |
2 |
0.01 |
6 |
0.03 |
8 |
0.03 |
5 |
0.02 |
|
Yugoslavs |
222 |
1.51 |
50 |
0.31 |
144 |
0.71 |
85 |
0.37 |
|
Turks |
402 |
2.73 |
184 |
1.14 |
- |
- |
- |
- |
|
Other |
33 |
0.25 |
102 |
0.67 |
178 |
0.87 |
257 |
1.12 |
|
Municipality of Bijelo Polje |
||||||||
|
Total |
46,651 |
|
52,598 |
|
55,634 |
|
55,145 |
|
|
Montenegrins |
34,750 |
74.48 |
29,862 |
56.77 |
32,172 |
57.82 |
27,146 |
49.23 |
|
Serbs |
420 |
0.90 |
3,493 |
6.64 |
949 |
1.70 |
4,174 |
7.57 |
|
Muslims |
9,857 |
21.12 |
18,553 |
35.27 |
20,840 |
37.45 |
22,970 |
41.65 |
|
Shqiptars /Albanians/ |
10 |
0.02 |
38 |
0.07 |
55 |
0.09 |
54 |
0.09 |
|
Croats |
38 |
0.08 |
67 |
0.12 |
39 |
0.07 |
50 |
0.09 |
|
Yugoslavs |
209 |
0.44 |
293 |
0.55 |
1,087 |
1.95 |
301 |
0.54 |
|
Turks |
1,308 |
2.80 |
84 |
0.15 |
- |
- |
- |
- |
|
Other |
59 |
0.16 |
208 |
0.43 |
492 |
0.92 |
450 |
0.83 |
|
Municipality of Pljevlja |
||||||||
|
Total |
46,677 |
|
46,843 |
|
43,316 |
|
39,628 |
|
|
Montenegrins |
38,614 |
82.72 |
29,630 |
63.25 |
32,323 |
74.62 |
21,887 |
55.23 |
|
Serbs |
769 |
1.64 |
7,922 |
16.91 |
2,296 |
5.30 |
9,647 |
24.34 |
|
Muslims |
6,794 |
14.55 |
8,530 |
18.20 |
6,967 |
16.08 |
6,999 |
17.66 |
|
Shqiptars /Albanians/ |
15 |
0.03 |
26 |
0.05 |
16 |
0.03 |
13 |
0.03 |
|
Croats |
83 |
0.17 |
43 |
0.09 |
54 |
0.12 |
13 |
0.03 |
|
Yugoslavs |
91 |
0.19 |
355 |
0.75 |
1384 |
3.19 |
784 |
1.97 |
|
Turks |
227 |
0.48 |
54 |
0.11 |
- |
- |
- |
- |
|
Other |
88 |
0.22 |
283 |
0.64 |
276 |
0.66 |
285 |
0.74 |
Note: In Albania, the Shqiptars/Albanians/I form the nation in their state. As a national minority they live in Greece and on the territory of the former S. F. R. of Yugoslavia.
The Ulcinj municipality is situated in the south-east of the Montenegrin Littoral towards Albania. It covers the area of 255 sq. km. and in 1991 24,482 inhabitants lived in the region. According to size, the municipality ranks 18th and according to population 8th in Montenegro. The growth index of the population was 126.06 from 1948 to 1961 and 151.00 from 1961 to 1991. The number of the Montenegrins and the Serbs in the Ulcinj municipality has been dropping for years, this index being 94.10 in the period 1971-1991. The Montenegrins have ethnic prevalence in six (15.38%) settlements (the 1981 data), i.e. on only 10.60% of the whole municipal territory. The growth index of the Muslim population was 163.60 in the period 1971-1991; they were in majority on 2.80% of the municipal territory. In the period 1971-1991, the growth index of the Shqiptar population was 128.79. The Shqiptar national minority prevails in 28 (71.79%) settlements covering 75.70% of the municipal territory. In the period 1971-1991, the number of Yugoslavs increased from 522 to 1134 or by 117.24%. The members of other peoples and ethnic groups in relation to the total number of the municipality population increased by 275.95% in the period 1971-1991.
The Bar municipality ranks 10th according to size and 6th according to population in Montenegro. After the Second World War the population in Bar has been constantly increasing due to the building of the Belgrade-Bar railway line, the development of the Port of Bar, the building and the reconstructing of industrial plants and the development of tourism. In the period 1948-1961 the population growth index was 114.42 rising to 151.83 in the period 1961-1991. In 1981, the Montenegrins comprised majority on 75.60% of the municipal territory, the Croats on 15.00%, the Muslims on 3.80%, the Yugoslavs on 1.00% and there was no ethnic prevalence on 4.60% of the territory. The Bar municipality consists of 83 settlements. The Montenegrins have majority in 65 settlements (78.31%), the Shqiptars in 8 (9.67%), the Muslims in 4 (4.81%), the Yugoslavs in 2 (2.40%), while in 4 (4.81%) settlements there is no ethnic prevalence. In the period 1971-1991 the population growth index of the Montenegrins and the Serbs was 119.01, but in relation to the total municipality population it dropped by 8.30%. The Muslim population increased by 91.78% in the same period, which means an increase from 9.79% to 13.87% in the municipality. The Shqiptar national minority increased by 10.63% in the same period, but in relation to the total municipality population it decreased from 15.49% in 1971 to 12.51% in 1991. Every port town as well as large towns lose their homogeneous ethnic structure due to the immigration of the population of various nationalities in search of jobs. The Bar municipality of today has a very heterogeneous population structure and the number of the Montenegrins and Serbs has been going down in relation to the total population.
The Budva municipality covers the area of 122 sq. km. According to size the municipality ranks 9th, and according to population 14th in Montenegro. Owing to the development of tourism the population is steadily increasing in number and the municipal centre is becoming a "hotel town". In the period 1948-1961 the population growth index was 126.37 and in 1961-1991 it was 224.24. The Montenegrins live on 95.10% of the municipal territory, the Muslims on 2.50%, no ethnic prevalence on 0.80% of the territory, and 1.60% of it is uninhabited or there are no precise data available. Our of 33 settlements in the municipality, the Montenegrins constitute the majority in 28 (84.84%), the Muslims in one (3.03%), one (3.03%) settlement has no ethnic majority, and there are no exact data for three (9.10%) settlements. In the period 1971-1991 the growth index of the Montenegrins and the Serbs was 183.49. A considerable number of the inhabitants of Budva declared themselves as Yugoslavs (8.59%) in 1991. The members of other peoples and ethnic groups were not numerous.
The Tivat municipality ranks 20th according to size and 15th according to population in Montenegro. It covers the area of 44 sq. km. The Montenegrins constitute the majority on only 8.70% of the territory, the Croats on 26.10%. and no people or ethnic group have a prevalence on 65.20% of the territory, Only one settlement (8.33%) has the majority of the Montenegrins, three (25%) of the Croats, and there is no ethnic prevalence in 8 (66.67%) settlements. In the period 1948-1961 the population growth index was 118.76. and in the period 1961-1991 it was 190.89. In the period 1971-1991 the growth indices were: the Montenegrins and Serbs 211.34, the Yugoslav; 370.03, and the Croats 78.90. It is obvious that the number of the Yugoslav:
has been increasing in relation to the Croats, which also applies to the Serbian population in the places where the Croats comprise majority.
The Kotor municipality covers the area of 335 sq. km. It ranks l6th according to size and 10th according to population in Montenegro. Apart from tourism Kotor also developed other branches of economy and it is an important immigration centre of the Bay of Kotor. The Montenegrins are the majority on 89.90% of the municipal territory, 9.60% is without any ethnic prevalence 0.50% of the territory is uninhabited. In 36 (78.26%) settlements the Montenegrins constitute the majority of the population, the Yugoslavs in two (4.34%), no ethnic prevalence in 7 (15.23%) settlements, and there are no data for one (2.17%) settlement. In the period 1948-1961 the population grower index was 117.82 and in the period 1961-1991 it was 134.82. In the period 1971-1991 the growth index for the Montenegrins and Serbs was 115.07, the Muslims 207.14, the Yugoslavs 191.00, while the counts of other nationalities; were decreasing (Croats by 38.10%, Shqiptars by 14.29%, others by 3.14%) Kotor is characteristic of the major share of the Yugoslavs (18.48%) in the total population.
The Herceg Novi municipality ranks 17th (area of 235 sq. km. according to size and 7th according to population in Montenegro. Due to the development of tourism the population in this municipality increased after the Second World War. In the period 1948-1961 the population growth index was 121.43, and in the period 1961-1991 it was 182.02. The Montenegrins constitute the majority on 37% of the territory, and there is no ethnic majority on 63% of the territory. They also constitute ethnic majority in 16 (59.26%) settlements, while there is no ethnic majority in 11 (40.74%) settlements. The municipality of Herceg Novi has an important geostrategic position. The Montenegrins and Serbs account for 71.58% of the population and the Yugoslavs for 19.05%. In the period 1971-1991 the number of the Serbs and Montenegrins increased by 43.15%, the Shqiptars by 24.09%, the Muslims by 304.87%, the Yugoslavs by 105.91%, and the members of other peoples and ethnic groups by 47.29%. The municipality and the town of Herceg Novi are the guardian of the Serbian ethnic being in this part of Montenegro.
The Podgorica municipality ranks first according to population and second according to area. It is the economic, political, and cultural centre of Montenegro and the number of population keeps going up largely due to immigration. In the period 1948-1961 the growth index of the population in this municipality was 148.80, and from 1961 to 1991 it was 210.86. The Montenegrins and Serbs make 79.90% of the population, the Shqiptars 8.50%, the Muslims 5.18%, and the members of other national minorities and ethnic groups 6.42%. The Montenegrins constitute majority on 82.50% of the municipal territory and in 105 (73.45%) settlements. In the period 1971-1991 the growth index for Montenegrins and Serbs was 155.45, Shqiptar national minority 106.53, Yugoslavs 264.57, Muslims 217.62, and other national minorities and ethnic groups 231.73. The Shqiptars comprise ethnic majority on 15.70% of the territory and in 35 (24.47%) settlements. The proportion of other national minorities and ethnic groups in the total population of the municipality is not considerable.
The Plav municipality is situated in the highland region of eastern Montenegro. It ranks 12th according to population and to size. In the period 1948-1961 the population growth index was 119.97 and from 1971 to 1991 it was 102.11 points. The Montenegrins and Serbs make 19.51% of the population. The Montenegrins comprise ethnic majority on 29.60% of the municipal territory and in 6 (26.09%) settlements. In the period 1971-1991 he growth index for Montenegrins and Serbs was 65.56, which means that [hey dropped in number by 34.44%. The Muslims constitute ethnic majority on 34% of the territory and in 12 (52.17%) settlements. In the period 1971-1991 their number increased by 19.34%. The number of the Shqiptars increased by 7.14% and they have majority on 25.10% of the territory and in three (13.04%) settlements. Finally, it is necessary to point out that the process of homogenisation of the Shqiptar and Muslim population has been taking place for some time and it will continue in the future.
The Berane municipality covers the area of 1000 sq. km. It ranks 4th according to size and population. The Montenegrins constitute ethnic majority on 82.30% of the municipal territory and in 68 (75.60%) settlements, and the Muslims on 17.70% of the territory and in 22 (24.40%) settlements. In the period 1948-1961 the population growth index was 116.86 and in the period 1961-1991 it was 103.60. In the period 1971-1991 the growth index for Montenegrins and Serbs was 92.30, and for Muslims 95.36. In the north-east of the municipal territory the process of rapid homogenisation of the Muslims has been taking place. The proportion of other national minorities and ethnic groups in the total population of the municipality is not considerable.
The Rožaje municipality covers the area of 432 sq. km. It ranks 14th according to size and 9th according to population. The Muslims constitute absolute majority on 69.90%, and the Shqiptars on 19.00% of the municipal territory. The Montenegrins are in absolute majority in only three (11.50%) settlements, and on 8.10% of the territory. In the period 1948-1961 the population growth index was 133.06 and in the period 1961-1991 it was 155.62 points. In the period 1971-1991 the number of the Montenegrins and Serbs decreased by 47.25% and the number of the Muslims increased by 60.57%. In the whole territory the process of Muslim homogenisation has been rather intensive. In the southern part of the municipality the Shqiptar national minority is prevalent.
The Bijelo Polje municipality covers the area of 924 sq. km. It ranks 5th according to size and 3rd according to population. The Montenegrins constitute ethnic majority on 72.60% and the Muslims on 25% of the municipal territory. The Montenegrins have absolute majority in 56 settlements (57.10%), and the Muslims in 38 (38.80%) settlements. There is no ethnic majority in four (4.10%) settlements. In the period 1948-1961 the population growth index was 126.78 and in the period 1961-1991 it was 118.20 points. In the period 1971-1991 the population growth index for Montenegrins and Serbs was 93.89 and for Muslims 123.80. The process of Muslim ethnic homogenisation has been taking place in the eastern part of the municipality.
The Pljevlja municipality is located in the northern part of Montenegro. It covers the area of 1346 sq. km. It ranks 3rd according to size and 5th according to population. The Montenegrins and Serbs constitute ethnic majority on 89.10% and the Muslims on 8.90% of the municipal territory. The Montenegrins and Serbs have ethnic majority in 130 settlements (82.91%), and the Muslims in 19 (12.02%) settlements. In the period 1948-1961 the population growth index was 129.92 and in the period 1961-1991 it was 84.98. In the period 1971-1991 the population growth index of the Montenegrins and Serbs was 83.97, and of the Muslims 82.05. This is the only municipality in Montenegro inhabited by a greater number of Muslims where this number is decreasing.
The territories of the following municipalities: Cetinje, Danilovgrad, Kolašin. Mojkovac, Nikšić, Plužine, Šavnik, and Žabljak have high ethnic homogeneity of the Montenegrin and Serbian people and the scientific analysis of their ethnic structure is not necessary. These municipalities are located in the highland part of central and western Montenegro.
The following ethnodemographic characteristics can be derived form the ethnic structure of the population of Montenegro by municipalities: all of the coastal municipalities have heterogeneous ethnic structure except Ulcinj where the Shqiptar /Albanian/ minority has ethnic homogeneity; the population in all of the coastal municipalities is increasing due to immigration for employment reasons, particularly in tourism, and due to the high birth rate in Ulcinj; the index denoting an increase in population in all of the municipalities with developed economic and other activities and services is high (index 1991/1971: Podgorica 210.86, Tivat 190.89, Herceg Novi 182.02) in comparison with the underdeveloped municipalities (Šavnik 49.06, Plužine 59.14, Kolašin 74.55, Žabljak 74.64, Danilovgrad 83.85); the municipalities located in central and western Montenegro have a high degree of ethnic homogeneity of Montenegrins (Cetinje 92.98%, Danilovgrad 89.91%, Kolašin 93.21%, Mojkovac 92.53%, Plužine 91.82%, Šavnik 93.66, and Žabljak 91.63%); the high degree of ethnic homogeneity is also achieved by the Muslim population in the municipalities of Rožaje (87.62%), Plav (58.09%), and in some parts of the territories of the municipalities of Bijelo Polje and Berane; also the Shqiptar national minority has reached a high degree of ethnic homogeneity (72.10%) in Ulcinj and the parts of Podgorica, Plav, and Rožaje municipalities.
Table 3 Ethnic Structure of the Population in Montenegro
|
Year |
1961 |
1971 |
1981 |
1991 |
||||
|
Count |
% |
Count |
% |
Count |
% |
Count |
% |
|
|
Total |
471894 |
|
529592 |
|
584310 |
|
615447 |
|
|
Montenegrins |
383978 |
81.36 |
355632 |
67.15 |
400488 |
68.54 |
380664 |
61.85 |
|
Serbs |
14,087 |
2.98 |
39,512 |
7.46 |
19,407 |
3.32 |
57,176 |
9.29 |
|
Muslims |
30,665 |
6.49 |
70,236 |
13.26 |
78,080 |
13.36 |
89,909 |
14.60 |
|
Shqiptars /Albanians/ |
25,794 |
5.46 |
35,634 |
6.72 |
37,735 |
6.45 |
40,880 |
6.64 |
|
Croats |
10,664 |
2.25 |
9,192 |
1.73 |
6,904 |
1.18 |
6,249 |
1.00 |
|
Gypsies/Romanies |
- |
- |
397 |
0.07 |
1,471 |
0.25 |
- |
- |
|
Yugoslavs |
1,559 |
0.33 |
10,930 |
2.06 |
33,146 |
5.67 |
25,854 |
4.20 |
|
Turks |
2,392 |
0.50 |
397 |
0.07 |
- |
- |
- |
- |
|
Other |
2,755 |
0.63 |
7,662 |
1.48 |
7,079 |
1.23 |
14,715 |
2.42 |
 |
|
Fig.
1. - Ethnic structure of the population in Montenegro from 1961
to 1991
|
The following conclusions can be derived, among others, from Tab 3: in 1961 a large number of the Muslims declared themselves as Montenegrins which was not characteristic of the 1971, 1981, 1991 censuses; the fact that in one census year the relative and absolute counts of the Serbs increase and counts of the Montenegrins decrease shows that the same individuals sometimes declare themselves as Serbs and sometimes as Montenegrins depending upon socio-political circumstances; in the period of 1971-1991, the population growth index for Serbs and Montenegrins is 110.80 points (Montenegrins 107.03 and Serbs 144.70), which is a slight increase if the span of 20 years is taken into account; in the period 1971-1991 the growth index for the Muslim population is 128.00, which is a considerable increase compared to the population growth indices of the Serbs and Montenegrins; the Shqiptar /Albanian/ national minority has been steadily increasing in absolute number since 1961; the absolute number of the Croats has been steadily decreasing since 1961 largely due to their declaring themselves as Yugoslavs in the coastal towns, the growth index being 236.54. Other national minorities and ethnic groups increased by 434% in the period 1961-1991.
The changes in the ethnic structure of the population of Montenegro after World War II were caused by a set of socio-economic, cultural, and, especially, political factors. The position taken by the leaders of the Yugoslav League of Communists concerning the division of the Serbian people was crucial for the Serbs in Montenegro to declare themselves as a separate people:
the Montenegrin people. Also, the political leaders of the Yugoslav League of Communists and of the Socialist Federal Republic of Yugoslavia seriously harmed the Serbian people by proclaiming the Serbs and Montenegrins of Muslim confession a separate people: the Muslim people. This was the reason why the number of the Serbs and Montenegrins in Montenegro decreased. The trend was particularly manifested in northern, north-eastern, eastern, and southern Montenegro where the confessional structure of the population is heterogeneous. Also, in eastern and southern Montenegro there is a numerous Shqiptar/Albanian/ national minority that is undergoing demographic explosion. The number of the Montenegrins and Serbs in Montenegro will decrease in the future if the demographic, socio-economic, and political processes of the past persist. Changes in the demographic policy of Montenegro are necessary and they have to be based on scientific farts. They should be humane and equally applicable to all families, regardless of their ethnic origin and confession.
1. Petar II Petrović Njegoš, Gorski vijenac /Mountain Wreath/ (Belgrade-Cetinje: Prosveta-Obod, 1979), p.28.
2. Stefan Mitrov Ljubiša, Djela /Works/ (Cetinje-Budva: Obod-KC Budva, 1974), I, 25-27.
3. Ibid., p.76.
4. Batrić Jovanović, Crngorci o sebi /Montenegrins about Themselves/ (Belgrade: Narodna knjiga, 1976), p. 118.
5. Jovan Cvijić, Balkansko poluostrvo, 1 & 2 /Balkan Peninsula/ (Belgrade: Zavod za izdavanje udžbenika, 1966), p. 123.
6. Matija Bećković, Poeme /Poems/ (Belgrade: SKZ, 1983), p. ix.
Dr Vujadin Rudić is Professor of Methodic of Teaching Geography at the Faculty of Geography, University of Belgrade. His major area of research is Geography of Population and Settlements. In addition to numerous scientific papers (about forty), he has published Stanovništvo Toplice /The Population of Toplica/ (1978), Stanovništvo Prokuplja /The Population of Prokuplje/ (1992), Metodika nastave geografije /Methodics of Teaching Geography/ (1991), and Bijelo Polje /Monograph/ (1987, one of the co-authors).
// Projekat Rastko / Istorija //
[ Pretraga | Mapa Projekta | Kontakt | Pomoć ]