|
 |
Milena Spasovski, Dragica Živković and Milomir StepićThe Ethnic Structure of the Population in Bosnia and HerzegovinaSource: The Serbian Questions in The Balkans, University of Belgrade, publisher - Faculty of Geography, Belgrade 1995.
The oldest traces of the human population in the lands of Bosnia and Herzegovina date back to the Palaeolithic period (findings in the vicinity of Doboj, Prnjavor, in the River Usora valley, etc.). The Neolithic civilisation is presented by three cultural zones: the Adriatic in Herzegovina, the Pannonian-Balkan in Bosnia, and the transitional zone in the headwaters of the Bosna river; cultural and civilisation traces of the Bronze and Iron Ages can be found in different regions of Bosnia and Herzegovina. In the early and late classical period two cultural and civilisation layers of the Illyrians (Daorsi in eastern Herzegovina, Ardijejci, Dalmatians, Japodi, etc.), Celts, Ostrogoths, and others were formed, and they were mostly Romanized in Roman conquests at the beginning of this era. In the early Middle Ages the Eastern Goths forced their way into this region; the Avars and Slavs came in the middle of the 6th century. With the appearance of the medieval state of the Slav tribes in the 9th century started the process of ethnogenesis of the South Slav peoples of Bosnia and Herzegovina. The Turkish periodTowards the end of the 15th century the Turks conquered the territory of Bosnia (1463) and Herzegovina (1482) and it was then that the Muslim culture and civilisation influences were first introduced in these parts. They were reflected in the Islamization of the Slav and Slavicized Illyrian and Vlach population. The process of Islamization of the Slav population, very powerful until the mid 16th century, included the higher layers of the Orthodox society and Vlach tribal chiefs that by accepting Islam enjoyed tax exemptions and other privileges. This process, with its religious and social aspects influenced the way in which the national consciousness of the Muslims was formed. The first data on the population and their religious composition after the fall of the medieval Bosnian state in the middle of the 15th century can be found in the Turkish census listings. And the listing from the year 1468/1469 registered 37,125 Christian and only 332 Muslim houses in the region. The census listings for the Bosnian Sanjak (without Herzegovina) from the year 1489 showed that there were 25,068 Christian and 4485 Muslim houses. In the period 1520-1530, according to the Turkish historian Omer Lutfi Barkan there were 334,325 inhabitants in the Bosnian Sanjak, 38.7% of them were Muslims. The Turkish and Austrian sources state that, at the end of the 16th century and the beginning of the 17th, around 75% of the population in the Bosnian Pashadom were Muslims. Since then, according to numerous sources, the Muslim population decreased due to a number of wars in which they fought on the Turkish side. At the same time, the whole population, Muslim and Christian, considerably thinned in the 18th century due to frequent plague epidemics; according to the contemporaries, the 1813-1815 plague epidemic cut the population down to one half. Historical, geographical, ethnological, sociological, demographic research shows that the population development of the Serbian, Croatian, and Muslim population was accompanied by rather unfavourable economic, social, and political circumstances during the Turkish rule in Bosnia and Herzegovina from the 15th to 19th century. Frequent wars, religious persecutions, rebellions and uprisings, taking of children as tribute, high tributes and taxes, years of bad crops, epidemics, violence, and oppression caused high mortality rate and suffering of the whole population and instigated the migration flows that changed the ethnic structure of the population. So, with the Islamization of the Christian population coincided the process of their emigration from these regions, which has remained the main feature of the demographic development of the population of Bosnia and Herzegovina until the present day. At the same time, intense internal shifting of the population together with recurrent migrations and also immigrations (of the Muslim population in particular) changed the distribution of some ethnic groups in Bosnia and Herzegovina in the Turkish period. The population starred to move out first from lower regions (Posavina and river valleys) and then from highlands. The most intensive migration flows originated in the karst Dinaric regions of Herzegovina and western Bosnia. For centuries, the population from these regions, mostly Orthodox, headed towards Serbia, Dalmatia, Slavonija, Lika, and other parts of Croatia (Military Border, Senj and its surroundings) and some parts of Slovenia (Žumberak, Kranjska). The migrations from western Bosnia (from Glamoč and Unac, Kupres, Grahovo, Knežpolje) were heading towards Lika, Croatia, and Slovenia, and steady emigration flows from Bosnia and Herzegovina, Dalmatia, and Lika headed towards Slavonija, Srem, Banat, Bačka, and Baranja. The population from Herzegovina and Upper Podrinje settled in western Serbia and Šumadija. Very strong emigration flows from the Dinaric region of Bosnia and Herzegovina headed towards Dalmatia. Jovan Cvijić states that the first migrations to Dalmatia from the Dinaric hinterland started already at the end of the 12th century, and they became stronger in the Turkish period from the 15th to 18th century. These migrations shifted the medieval population of Dalmatia that had previously migrated mostly towards Croatia, Slavonija, and Italy. According to Cvijić, almost all of the population of Makarska, Omiš, Split, Šibenik and Bukovica originated from Bosnia and Herzegovina. Of the Herzegovina origin were the inhabitants of the city of Dubrovnik and the vicinity, while the population of the Bay of Kotor originated from the Montenegrin and Herzegovina Dinaric regions. Frequent war inroads and the changes of the boundaries between the Ottoman Empire and the Habsburg and Venice states were followed b; migrations. In the early Turkish period, emigrations were caused by social measures implemented to reinforce the new system (economic measures Islamization, taking of children as tribute), while towards the end of the Turkish rule they were mostly instigated by wars of liberation, uprisings am rebellions that mounted in power when the liberated Serbian state was constituted at the beginning of the 19th century. Sufferings and emigration from the 15th to 19th century lowered the total population potential of the Serbian Orthodox population in Bosnia and Herzegovina. The majority c them were Islamised and those relocated to Dalmatia were converted t Catholicism. In the Turkish period, the Catholic population had a great share in the emigrations from Bosnia, and Herzegovina. The emigration flows were directed towards Dalmatia, Croatia, Slavonija, Baranja and north-west Back At the same time, after the victorious wars of Austria against Turkey and the shifting of the border south of the Sava and Danube rivers, a portion of previous Croatian emigrants came back to Bosnia. According to the findings of many an author, the Muslim population, in the period of the Turkish rule, did not emigrate much compared to the migrations of the Orthodox and Catholic population. The Muslim population was characteristic of return migrations as soon as the political and economic situation again became stable or the state borders were shifted. The return movements of the Muslim population from the Coast, Lika, Slavonija, Hungary, and other places are well known. For example, after the siege of Vienna (1683-1699), territorial losses of the Ottoman Empire and the annexation of Lika and Krbava by the Austrian Army, mass movements of the Muslim population from those regions took place; the Muslim population headed towards Bihać, Cazin, and Bosanska Krupa where they created an enclave in the vast Serbian region of Bosnian Krajina. More intensified immigrations of the Muslim population were noticed in 1690 when they moved from Hungary and Slavonija to the region around the mountain of Majevica. In the Turkish period, the Muslim population increased in number in Bosnia and Herzegovina due to constant immigrations of their compatriots from the Sanjaks of Smederevo and Novi Pazar, and especially from some regions of Montenegro, Sjenica, and Pester. Immigrations of the Turkish population from Asia Minor also had impact upon the growth of the Muslim population in Bosnia and Herzegovina from the 15th to 19th century. The above and other assertions lead to a conclusion that intense internal movements and immigrations, especially steady emigrations of the population of Bosnia and Herzegovina in the period of the Turkish rule, 15th to 19th century, changed greatly the population potential that resulted from the natural population increase in these regions. Mobility differences are important determinants of the changes in number and distribution of the population. Mobility of the Serbian and Croatian population was much more intense in comparison with the Muslim population that, owing to this fact, had much more favourable conditions of development. This means that the distribution and the population potentials of some peoples stemmed from the complex, ethnic and regionally differentiated demographic development conditioned by natural and social factors in Bosnia and Herzegovina in the middle of the 19th century. At the bottom lay enormous losses in population due to high mortality rate in the time of wars, uprisings, rebellions, taking of children as a tribute, and slavery. These population losses were also a consequence of constant changes of residences and voluminous emigrational flows already established then, and were characteristic of Bosnia and Herzegovina till the present day. Population losses caused by high mortality, and intense emigrations had the worst effect upon the Serbian Orthodox population. Regarding the total population and the counts of some religious and ethnic communities in Bosnia and Herzegovina at the end of the Turkish rule, we find different values in the references and official statistical data. As to the Turkish censuses, many authors state that there were only 1,050,000 inhabitants in the present boundaries of Bosnia and Herzegovina in 1875 and at the beginning of 1876, which was low population density (about 20 inh per one sq. km). The data on number and percentage of the population by religions greatly differed in official and other censuses during the Turkish rule. According to Dj. Pejanović, the official censuses read as follows: the Orthodox population 32.63% to 46.60%; the Muslim 32.60% to 51.90%; the Roman-Catholic 14.97% to 20.17%.[1] The main feature of the distribution of the population in Bosnia and Herzegovina in the middle of the 19th century was the medley of the population (especially in towns), but in some regions the members of one of the three confessional communities were larger in number. The Orthodox population were, in spite of unfavourable conditions for development (Islamization, constant emigrations, high mortality rate in war and other disturbances), predominant in the total population potentials and comprised the majority on more than 53% of the territory of Bosnia and Herzegovina. These were the vast regions in western Bosnia, eastern Herzegovina, Posavina, in the middle and lower course of the Drina river, as well as some regions in central Bosnia. The restoration of the Patriarchate of Peć in the 16th century contributed greatly to the development and preserving of the Serbian national being in these lands. The historical events and the formation of the free Serbian state at the beginning of the 19th century had a decisive influence upon its ethnic homogenisation and the onset of liberation aspirations. Second in number were the members of the Muslim confession with more favourable conditions for demographic growth even though they suffered losses in the wars during the rule of the Ottoman Empire (better social and economic status, lower regional mobility, steady immigrations). From the geographical point of view, the Muslim population comprised majority in towns and in the regions of central and eastern Bosnia, as well as in some parts of western Bosnia (Cazin Velika Kladuša), i.e. on about 27% of the present territory of the Republic. It was characteristic for the Roman-Catholic population that it had considerably lower population potentials in Bosnia and Herzegovina in the Turkish period. They constituted majority in the south-western part of Bosnia and Herzegovina and in some regions of central and western Bosnia, i.e. on about 20% of the present territory of the Republic. The preserving of the Croatian national being in Bosnia and Herzegovina was aided by the establishment of the Franciscan order in 1463 that protected the Catholic population from Islamization and emigrations. In relation to the changes in the ethnic structure of Bosnia and Herzegovina until the mid 19th century it is important to point to the immigration of the Jews from Spain in the 16th century. They settled mostly in towns (Sarajevo, Travnik, Banja Luka, Bihać). The immigration of the Romanies, Cincars, Čerkez, in small numbers, coincided with the Turkish conquests in Bosnia and Herzegovina. They did not have any considerable effect upon the total population in these regions in the middle of the 19th century. The Period of Austro-Hungarian RuleThe annexation of Bosnia and Herzegovina in 1878 was the beginning of the 40-year long Austro-Hungarian rule in these regions (1878-1918) during which the ethnic structure of the population was transformed along with political, economic, and social changes. The earlier emigrational trends of the population in Bosnia and Herzegovina continued in this period under the influence of new political, religious, social, economic, and other factors. Emigrations were particularly intense in the times of occupations, after rebellions, uprisings, and fights for autonomy, after the annexation of Bosnia and Herzegovina, at the time of the Balkan wars (1912-1913), and especially after World War I (1914-1918). The Serbian and Muslim population emigrated most. The Serbs emigrated to Serbia and Montenegro and the Muslims to the regions in the Balkans under the Turkish rule (parts of Macedonia, Serbia, and Greece) and to Asia Minor (Anatolia and other parts). The most important routes of economic emigrations of the population from Bosnia and Herzegovina led to the lowlands north from the Sava and the Danube Rivers, to Central Serbia, the Coast, and other parts of the Balkan Peninsula, as well as to the countries in Europe, North America, South America, Australia, etc. The population from the poor karst regions of Herzegovina and Bosnia, mostly Catholic and Orthodox, had the greatest share in emigrations overseas. The most frequent immigrants to these regions were the population of the Slav origin of different vocations (craftsmen, tradesmen, civil servants of various professions, teachers, farmers, and others). They came from Dalmatia, Lika, Slavonija, other parts of Croatia, and from Slovenia. They were mostly Catholics, then, to some extent, Jews and the population of Orthodox and Muslim confession. The Orthodox and Muslim population immigrated, to a smaller extent, from Montenegro to Herzegovina and eastern and north-east Bosnia. After the Balkan wars a portion of the Muslim population returned to Bosnia from Skoplje, Bitolj, Thessaloniki, Sjenica, Pešter, and other regions of the Balkan Peninsula. Very important for the change in the ethnic structure of Bosnia and Herzegovina was the immigration of foreigners (Germans, Italians, Poles, Czechs, Hungarians, Ukrainians, Ruthenians, Slovaks) that were settled by the new administration. It should also be pointed to the internal extensive movements of the population in Bosnia and Herzegovina in the period of the Austro-Hungarian rule which, together with the above mentioned mobility of the population, changed the ethnic structure in this region. On the one hand, these changes led to ethnic homogenisation in some regions and, on the other hand, to the heterogeneous population of some settlements, particularly towns. The estimates of the number of emigrants and immigrants are different particular!) when taken by religions and ethnic origin. Some research workers, Pejanović among them, estimate that between 180,000 and 200,000 people immigrated into and about 260,000 emigrated from Bosnia and Herzegovina during the Austro-Hungarian rule. This shows that Bosnia and Herzegovina both in this period and in the Turkish period was mostly an emigrational region in which the migrations different by their ethnic origin had a positive impact upon the demographic development of the Catholic population due to their prevalence in overall immigrations, and a negative impact upon the development of the Orthodox population due to their high share in emigrations. The impact o migrations on the growth of the Muslim population is not as evident in the censuses because of their significant shares both in immigrations and emigrations. Austria-Hungary conducted four censuses in Bosnia and Herzegovina in 1879, 1885, 1895, 1910. The first three censuses dealt with the religion affiliations of the population and the last one included the native language, which read: a) Serbo-Croatian, and b) other. So, the ethnic structure of the population in Bosnia and Herzegovina in the period of the Austro-Hungarian rule could only be perceived through the confessional structure of the population. In the 1879 census 1,158,164 persons were registered in the territory of Bosnia and Herzegovina. The Orthodox Christians numbered 496,485 or 42.88%; the Muslims 448,613 or 38.75%; the Catholics 209,391 or 18.08%, and members of other religions 3675 or 0.31% of the total population. Until the 1910 census, the population in Bosnia and Herzegovina went up to 1,898,044 persons, at a growth index of 163.9 points. In the same period the Orthodox population reached the count of 825,918 persons or grew by 166.4 points, while its share in the overall population increased insignificantly, to 43.49%. Until 1910, the Muslim population reached the number of 612,137 persons or 136.5 index points, and its share in the overall population went down to 32.25%. In this period of the Austro-Hungarian rule the Catholic population increased rapidly compared to the Orthodox and Muslim population and in 1910 it reached the number of 434,061 people or 22.87% of the overall population. The growth index was 207.3 points and it is connected to the above mentioned greater share of the Catholic population in the overall immigrations into Bosnia and Herzegovina. The population of other religions and nationalities increased in number even more rapidly, from 3675 to 26,428 or from 0.31% to 1.39% of the total population (index 719.1 points). This is a clear indication of the importance of immigrations of foreigners in the changing of the ethnic structure of the population in Bosnia and Herzegovina in the period of the rule of Austria-Hungary. Table 1 Population of Bosnia and Herzegovina by Religion Censuses from 1879 to 1910[2]
Thus, it can be concluded that in the period of the Austro-Hungarian rule in Bosnia and Herzegovina the Orthodox population was absolutely predominant in the overall population potential of the region in spire of many unfavourable conditions for its demographic growth, in 1910, the Orthodox population comprised the majority in 27 districts: Bosanska Dubica (82.94%), Bileća (81.27%), V. Vakuf (76.61%), Bosanski Petrovac (78.83%), Glamoč (77.26%), Bosanski Novi (76.07%), Bosanska Gradiška (71.98%), Trebinje (71.38%), Nevesinje (71.06%), Banja Luka rural district (70.96%), Bijeljina (70.57%), Ključ (66.43%), Bosanska Krupa (64,81%), Vlasenica (64.34%), Gacko (64.03%), Kotor Varoš (63.44%), Sanski Most (61.41%), Prnjavor (60.89%), Prijedor (59.08%), Ljubinje (58.40%), Sarajevo - rural district (56.06%), Zvornik (54.78%), Maglaj (53.55%) Višegrad (48.62%), Jajce (47.12%), Tešanj (46.09%), Gradačac (35.90%). In the same period the Muslims comprised the majority in the town of Sarajevo and in 15 districts, The Catholics had majority in 12 districts. At that time, this population had the most favourable conditions for demographic growth. It is important to mention the Jews among other population in Bosnia and Herzegovina, They comprised 0,62% of the total population and lived mostly in the town of Sarajevo and other urban settlements. In 1910, the shares of the urban population were: 50.76% Muslims, 24.49% Catholics, and 19.92% Orthodox. The Period between the two World WarsThe changes in the ethnic structure of Bosnia and Herzegovina in this period were affected by war sufferings (1914-1918), emigrations of the members of the earlier colonised foreign population, and the above described migrational flows to other regions of Yugoslavia and other countries. It is difficult to determine the impact of direct and indirect war losses in World War f upon the total population growth and counts in Bosnia and Herzegovina. Pejanović states that the losses were 320,000 people with different counts according to confession. The losses of the Orthodox population were 200,000 people The fact was that "in war camps and prisons almost the sole element was the Orthodox element, the volunteers were almost all Orthodox, and the billed were of the Orthodox religion only, and in the war the Orthodox population were killed at least proportionately to its population." Immediately after the First World War and after the formation of the state of Serbs, Croats, and Slovenes, a number of the earlier colonised foreign population: Germans, Czechs, Poles, Slovaks, Hungarians, Ruthenians emigrated from Bosnia and Herzegovina to their homelands. Then, the planned resettling within the borders of the new state was effected and mostly the Orthodox Serbian population were moved out of the passive regions of Herzegovina and Bosnia. They were moved to Vojvodina (eastern Banat), Kosovo and Metohia (from Kačanik to Vučitrn, around Priština, Lipljan, Peć, Istok, Djakovica, and in Drenica), and some to Macedonia. At the same time, the earlier emigrational tendency of the Muslim population towards Turkey continued, as well as all other forms of emigrations caused by economic factors. So, a great number of the population, among whom the Serbs and Croats from the karst regions of Herzegovina and western Bosnia were most numerous, moved to the northern regions of Yugoslavia and abroad (North and South America, Canada, France, Belgium, etc.). Thus, in this period between the two wars Bosnia and Herzegovina was mostly an emigrational region; the impact of migrations upon different confessions was selective. In spite of this, the ratio of population potentials of some ethnic groups and their geographical distribution were not significantly changed. Data on the ethnic structure of the population between two world wars exist in the 1921 and 1931 censuses. The census of January 31, 1921, makes it possible to indirectly determine nationality from the data on mother tongue and religion, since the question on nationality was not included. The final return, published in 1932: Final Returns of the Census of January 31, 1921, showed that under the name of mother tongue the names of the nationalities were understood. These data cannot give us the count and the distribution of Serbs, Croats, and Muslims in Bosnia and Herzegovina since Serbs and Croats were put together in one column ("Serbs or Croats"), and the undecided Muslims were in the column "other undecided and others". The census of March 31, 1931, contained, besides the questions on language and religion, a question on nationality. According to the Census Instructions, the question on nationality was to be answered as follows: Yugoslav or other. Under the term "Yugoslav" all Yugoslav nationalities were given together, i.e. as a single nationality. Other nationalities were classified under the exact names: German, Hungarian, Turkish, etc. The above classifications of the 1921 and 1931 censuses do not make it possible to determine the ethnic structure of the population, so the population potential and distribution of Serbs, Croats, and Muslims in Bosnia and Herzegovina between the two wars can only be assessed indirectly through the question on religion. According to the 1921 census, there were 1,890,440 persons in Bosnia and Herzegovina: 829,290 or 43.87% Orthodox; 588,244 or 31.07% Muslims; 444,308 or 23.48% Catholics; other: 28,595 or 1.58% of the total population. According to the 1931 census, there were 2,323,555 persons in Bosnia and Herzegovina: Orthodox 1,028,139 or 44.25%; Muslims 718,079 or 30.90%; Catholics 547,949 or 23.58%; other: 29,388 or 1.27% of the total population. The above data show that the Orthodox population had the strongest potential in Bosnia and Herzegovina between the two wars, which remained a true fact in spite of the earlier mentioned enormous war and other sufferings of the Serbs if compared to the others in the previous period. The share of the Orthodox population changed very little in the period 1921-1931 (43.87% : 44.25%). In the same period, the Muslim population was second in number, with the growth index of 122.1 points, and insignificant change in their share (31.07%: 30.90%). A characteristic of the Catholic population was their almost identical share in the total population in both censuses between the wars (23.48%: 23.58%) and the growth index of 123.4 points. The distribution by religion was in general identical to that in the previous period. In 1921, the Orthodox population had the absolute or relative majority in 27 towns and districts, the Muslim in 16, and the Catholic in 12. In 1931, the Orthodox population comprised the majority in 28 districts, Muslim in 13, and Catholic in 12. In 1921, in the district of Sarajevo, the Orthodox were absolutely predominant (56.3%), while the Muslim population constituted the majority (33.9%) in the town of Sarajevo. In 1931, in the district of Sarajevo the Orthodox population numbered 55,477 persons (38.6%), the Muslims 50,270 persons (34.9%), the Catholics 29,395 persons (20.4%), others 8768 persons (6.1% out of the total). The Orthodox population also constituted the majority in five out of eight municipalities of the district of Sarajevo (Ilidža, Koševo, Pale, Rajlovac, and Trnovo) and the Muslim population in two (Bjelašnica and Ozren) and in the town of Sarajevo. In the town of Sarajevo there were 78,173 inhabitants: 29,649 (37.9%) Muslims, 21,373 (27.3%) Catholics, 18,630 (23.8%) Orthodox, and 8522 (11.0%) other.
In 1931, the Orthodox population constituted the absolute or relative majority in the following districts: Banja Luka (59.9%), Bihać (43.7%), Bosanska Dubica (84.9%), Bosanska Gradiška (69.2%), Bosanska Krupa (67.1%), Bosanski Novi (79.2%), Bosanski Petrovac (75.7%), Bosansko Grahovo (94.4%), Jajce (49.8%), Ključ (66.6%), Kotor Varoš (62.9%), Maglaj (43.8%), Mrkonjić Grad (81.4%), Prijedor (58.6%), Prnjavor (61.2%), Sanski Most (60.5%), Teslić (67.7%), Glamoč (80.1%), Bileća (80.3%), Gacko (61.9%), Ljubinje (58.0%), Nevesinje (71.3%), Trebinje (72.2%), Bijeljina (70.6%), Sarajevo Town (38.6%), Srebrenica (50.5%), Višegrad (49.3%), Vlasenica (67.3%).
The Period after the Second World WarChanges in the ethnodemographic structure of the population of Bosnia and Herzegovina after World War II can be defined on the basis of all six censuses in the period 1948-1991. The self-declaration of national origin was classified under "people" and "national minority" in the first of these censuses and under "people" and "nationality" in the last ones. The persons who die not declare themselves at all were also registered. It is not possible to compare data on national origin in these censuses since different solutions in the classification were resorted to when Muslims were concerned. In the 1948 census, they were registered as "undecided Muslims", while the Muslim population who declared themselves as Serbs, Croats, or others, were registered in the same way. In the 1953 census, the Muslims were registered under "undecided Yugoslavs" as well as some persons who were not of Muslim affiliation. In the 1961 census, the Muslims were treated as an "ethnic group", and in the censuses 1971-1991, as one of the six constitutive peoples of Yugoslavia. So, until 1961, Muslims were practically registered in. the column "Yugoslavs", and from the sixties on, the social and political milieu was such as to enable a statistical follow-up of the ethnic consolidation of the Muslims. Since then except the 1991 census, no particular ethnic origin was understood under the term "Yugoslav" and the persons who declared themselves thus were put in the category of the nationally undecided. All of the above show that the censuses after World War II offer considerably more data on the ethnic structure of the population, but the mentioned constraints show that it is only a statistical view which is greatly dependent upon the status and relationships in the social and political development of a society and its administrative and state organisation. The 1941-1945 war was crucial for the changes in the population and I their geographical distribution in Bosnia and Herzegovina found in the censuses from 1931 to 1948. Sufferings in the war, adverse conditions for biological reproduction, intense internal migrations, immigrations, particularly numerous refugees, and other factors determined the demographic growth in the region in the mid 20th century. It is also necessary to point out that both components of the population growth (mortality rate and migration) had different impact upon the peoples in Bosnia and Herzegovina in World War II. It is well known that in Bosnia and Herzegovina in the course of World War II the Serbian population had greatest losses in men and material. The Serbs, Jews and Gypsies were the victims of the genocide executed in the Independent State of Croatia between 1941 and 1945. Many of them were killed in combat in which the share of the Serbian population was the greatest expressed both in absolute and relative numbers. The list of victims of the 1941-1945 war, made in 1964, is kept in the Documentation of the Federal Bureau of Statistics in Belgrade. It contains the names of 179,173 persons killed in the war born in Bosnia and Herzegovina. This list is not complete. The ethnic structure in this fragmental list of the war victims confirms the well-known fact that the Serbian population had greatest losses in this region. The war victims in Bosnia and Herzegovina, according to the above mentioned excerpt from the census, were 72.1% Serbs (129,114), 16.5% Muslims (29,539), 4.4% Croats (7850) and 7.0% of other nationalities. In the emigrational flows due to war suffering the Serbs had the greatest share, already in 1941 the Serbian population were in refugee lines mostly towards Serbia and Montenegro. That was a part of the plan of the Fascist forces in Germany and in the Independent State of Croatia (NDH) to expel 260,000 Serbs so that the same number of the Slovenes could settle in. So, already at the end of 1941, the German reports from the Balkans stated that 110,000 Serbian refugees from NDH went to Serbia. According to other sources, 100,000 men, women and children fled from NDH to Serbia in the period May-August 1941; according to some estimates their number varied between 200,000 and 400,000 refugees. Some estimates state that 137,000 Serbs were banished from Bosnia and Herzegovina. At the same time, the Ustashi organised immigrations of the Croats, and also of the Muslims from Macedonia, Kosovo, Vojvodina, and Serbia for the purpose of strengthening their ethnic element in Bosnia and Herzegovina. A small number of the Serbian refugees of the period between 1941 and 1945 returned to Bosnia and Herzegovina, which, together with tremendous war losses, was rather unfavourable for further demographic growth of the Serbian population in this region. Taking into account the planned relocation of mostly the Serbian population from Bosnia and Herzegovina from 1945 to 1948, the damages done to the population potential of Serbs in this region are obvious. For example, 98% of the emigrants to Vojvodina were Serbs and only 2% Croats and Muslims. This strengthened the Serbian national element in Vojvodina (central and southern Bačka, Banat, etc.), but this emigrational flow itself weakened the Serbian population in Bosnia and Herzegovina for the body of about 70,000 people. After the planned colonisation, according to the well-known laws of migration, emigrations continued in the same direction motivated by educational, work, and other reasons. During World War II, the Muslim population from Bosnia and Herzegovina were exposed to suffering and intense relocation. They participated to a smaller degree in refugee flows (for example, from Bjelovar and some parts of Slavonija), but participated greatly in internal relocations, especially from villages into towns. To the towns, particularly to Sarajevo, went a portion of the Muslim population from Serbia, Montenegro, Kosovo and Metohia, and Macedonia during the war. Thus, apart from minor war losses, the negative impact of migrations upon the number and demographic growth of the Muslim population in Bosnia and Herzegovina in World War II was not significant. Also, in the planned colonisation after the war and the agrarian reform, a portion of the refugees (muhadžir) who had fled to Croatia returned to Bosnia and Herzegovina (to Mostar, Doboj, Tuzla, and Banja Luka), which proved to be favourable for the ethnic development of the Muslims. In the fifties the process of industrialization, urbanization and deagrarization in Bosnia and Herzegovina became intense and greatly changed the components of demographic growth (natural movements and migrations). Modern demographic literature points to intense differentiation in natural reproduction and mobility of the population according to nationalities in Yugoslavia, with considerable impact upon the changes in the total population potential and the distribution of the peoples and national minorities. The earlier mentioned influence of migrations on the nationalities in Bosnia and Herzegovina, evident since the period of the Turkish rule, has been the same by extent and directions until the present day. At the same time, with the intensified process of demographic transition that starred in the fifties due to industrial and social transformation, the differences appeared in the rate of changes in reproduction according to nationalities. So, the differentiated demographic growth by nationalities of the most recent period, together with the centuries-long similar trends, the consequences of war suffering and the genocide from World War II on the age structure as a demographic frame of reproduction, caused noticeable changes in the number and share of some peoples in the total population potential in this region after the sixties. Migrations and Changes in the Ethnic StructureThe censuses after World War II indicate an increase in the number of the migrant population in the total population, i.e. intense regional mobility of the population in Bosnia and Herzegovina. In the period 1961-1981, the share of the migrant population in the total population went up from 27.7% to 32.2%, as a consequence of expansive local and regional migrational routes. In 1981, those who migrated within the same municipality comprised 44.1%, and those from the other municipality of Bosnia and Herzegovina constituted 44.4% of the total migrant population. These movements after World War II instigated considerable internal relocations of the population. On the one hand, the result of these relocations was loss of population in rural settlements and highland areas, especially in karst regions of western Bosnia and Herzegovina inhabited mostly by the Serbian population. On the other hand, there was a trend of the population to concentrate in central Bosnia, the most developed urban and industrial part of the Republic, and in the northern flat region suitable for all kinds of activities and population growth. This trend was based on the differences in natural conditions and resources of the mentioned regions, as well as on the concept of economic and urban development which was not a centralised one. This was the reason why the directions of internal migrations had selective impacts upon the population, the Serbian population from the highland regions having the greatest share in them. The centuries-long emigrational character of Bosnia and Herzegovina was at its height after World War II. In all post-war censuses this Republic, together with Montenegro and Macedonia, had a negative migrational balance, i.e. emigration surpassed immigration. At the same time, the emigrational flows from Bosnia and Herzegovina, the shifting between the republics and emigrations abroad became more intense, and the varied nature of the migrations by age and sex structure, economic, ethnic and other features was 'stressed. Based on the census and vital statistics data, the total population growth in Bosnia and Herzegovina was 1,559,948 persons in the period 1948-1981. In the same period, the natural increase was 2,108,906 persons, and migrational balance was negative -548,958 persons. This shows that almost one fifth of the natural increase was equal to emigration in this period. Negative migrational balance increased in absolute value before 1971: in 1948-1953 it was -35,270 persons; in 1953-1961 it was -164,130; in 1961-1971 it was -215,955; in 1971-1981 it was -133,603. According to the post-war censuses, the number of emigrants was three to four times greater than the number of immigrants into Bosnia and Herzegovina. From 1948 to 1981, the immigration race increased from 2.1%o to 3.4%o, the emigration rate from 8.2%o to 14.2%o, while the migration balance was negative, -3.92%o to -4.13%o. According to the 1981 census there were 141,330 immigrants into Bosnia and Herzegovina from other republics, while the number of emigrants to other republics of Yugoslavia was 583,602 persons, which created the negative balance of migration of -442,272 persons. This shows that Bosnia and Herzegovina became mostly an emigrational zone in the period after World War II.[3] Table 2 Rates of Immigration, Emigration and Balance of Migration by Nationalities in Bosnia and Herzegovina 1961-1981[4]
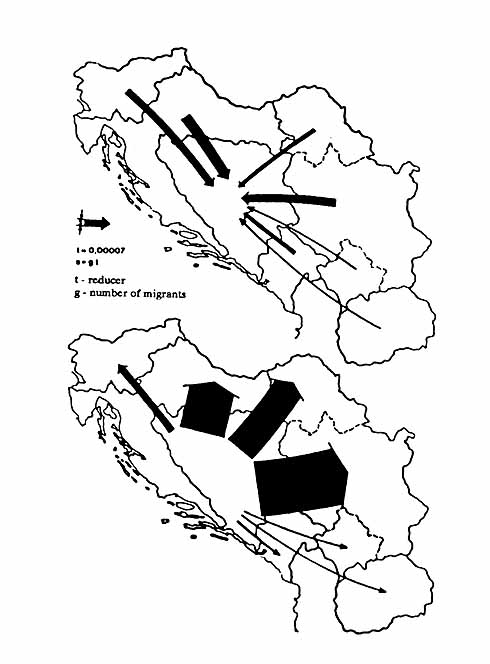
The directions of contemporary migrational flows between Bosnia and Herzegovina and other federal units and the participation of the population according to nationalities is different. The censuses from 1961 to 1981 showed much more intensified regional mobility of the Serbian and Croatian population in relation to the Muslim population in Bosnia and Herzegovina. So, among the Serbs and Croats there were five times more emigrants from this Republic than immigrants into it, and the same applies to the persons who declared themselves as Yugoslavs. With the Muslims, the ratio of immigrants to emigrants was almost equal, with the evident positive balance of migration until 1981. In 1961, the ratio of immigrants to emigrants was: Serbs 51,590 : 188,106; Croats 30,036: 59,724; Muslims 5622: 5603. In 1971, the immigrants to emigrants ratio was: Serbs 52,345: 250,849; Croats 28,053 : 137,997; Muslims 21,450: 20,684. The differences were even more pronounced in 1981 when the ratio of immigrants to emigrants was: Serbs 48,304: 266,637; Croats 24,515: 146,045; Muslims 26,895: 29,081.[5] Serbia and Croatia were the most frequent destinations of the emigrants from Bosnia and Herzegovina. By the 1981 census, 538,602 persons emigrated from Bosnia and Herzegovina, out of which 261,853 or 48.6% went to Serbia and 228,843 or 42.5% to Croatia. Only 33,530 or 6.2% emigrated to Slovenia. The directions of contemporary and earlier migration streams from Bosnia and Herzegovina differ by ethnic origin. The Serbs had both the absolute and relative shares in the emigrations from this Republic. According to the 1981 census, among those who emigrated from Bosnia and Herzegovina 266,625 or 49.5% were Serbs, 146,045 or 27.1% Croats. The Muslims, as the most numerous population in Bosnia and Herzegovina, participated in the emigrations from this Republic with only 5.4% (29,081 persons) which, together with other factors, contributed to their pronounced population expansion after the sixties. However, the persons who declared themselves as Yugoslavs comprised 10.8% of the total emigrant population from Bosnia and Herzegovina (58,383 persons) and their destinations were Croatia (49.7%) and Serbia (42.1%). Of the Serbs that emigrated from Bosnia and Herzegovina, 77.1% came to Serbia (45.7% to Vojvodina, 31.0% to Central Serbia, and only 0.4% to Kosovo and Metohia), while 17.6% went to Croatia and 4.3% to Slovenia. Of the total number of the Croats who emigrated from Bosnia and Herzegovina, 89.1% went to Croatia, 7.4% to Serbia, 3.1% to Slovenia, and an insignificant number to other republics. Lately, the directions of the Muslim emigrations from Bosnia and Herzegovina led to Croatia (45.5%), Slovenia (27.9%), and Serbia (21.1%), and less to Montenegro (2.8%) and Macedonia (2.7%). Table 3 Migration of the Population from Bosnia and Herzegovina
|
|||||||||||||||||||||||||||||||||||||||||||||||||||||||||||||||||||||||||||||||||||||||||||||||||||||||||||||||||||||||||||||||||||||||||||||||||||||||||||||||||||||||||||||||||||||||||||||||||||||||||||||||||||||||||||||||||||||||||||||||||||||||||||||||||||||||||||||||||||||||||||||||||||||||||||||||||||||||||||||||||||||||||||||||||||||||||||||||||||||||||||||||||||||||||||||||||||||||||||||||||||||||||||||||||||||||||||||||||||||||||||||||||||||||||||||||||||||||||||||||||||||||||||||||||||||||||||||||||||||||||||||||||||||||||||||||||||||||||||||||||||||||||||||||||||||||||||||||||||||||||||||||||||||||||||||||||||||||||||||||||||||||||||||||||||||||||||||||||||||||||||||||
|
Population immigrating Into: |
Population emigrating from Bosnia And Herzegovina |
||||||
|
Total |
Serbs |
Croats |
Muslims |
Yugoslavs |
Other |
||
|
Total |
538,602 |
266,625 |
146,045 |
29,081 |
58,383 |
38,468 |
|
|
Republic of Serbia |
261,853 |
205,542 |
10,870 |
6,144 |
24,608 |
14,689 |
|
|
central Serbia |
111,828 |
82.646 |
2,973 |
4,062 |
14,845 |
7.302 |
|
|
Vojvodina |
145,010 |
121,726 |
7,833 |
1,200 |
9,711 |
4,540 |
|
|
Kosovo & Metohija |
5,015 |
1,168 |
64 |
882 |
52 |
2,849 |
|
|
Croatia |
228,843 |
46,853 |
130,135 |
13,221 |
29,010 |
9,624 |
|
|
Macedonia |
4,896 |
874 |
174 |
787 |
213 |
2,848 |
|
|
Slovenia |
33.530 |
11,368 |
4,456 |
8,114 |
3,108 |
6,484 |
|
|
Montenegro |
9,480 |
1,988 |
410 |
815 |
1,444 |
4,823 |
|
|
Percentage shares |
|||||||
|
Total |
1000 |
1000 |
100.0 |
100.0 |
100.0 |
100.0 |
|
|
Republic of Serbia |
48.6 |
77.1 |
7.4 |
21.1 |
42.1 |
38.2 |
|
|
central Serbia |
20.8 |
31.0 |
2.0 |
14.0 |
25.4 |
19.0 |
|
|
Vojvodina |
26.9 |
45.7 |
5.4 |
4.1 |
16.6 |
11.8 |
|
|
Kosovo & Metohia |
0.9 |
04 |
0.0 |
3.0 |
0.1 |
7.4 |
|
|
Croatia |
42.5 |
17.6 |
89.1 |
45.5 |
49.7 |
25.0 |
|
|
Macedonia |
0.9 |
03 |
0.1 |
2.7 |
0.4 |
7.4 |
|
|
Slovenia |
6.2 |
4.3 |
3.1 |
27.9 |
5.3 |
16.9 |
|
|
Montenegro |
1.8 |
0.7 |
0.3 |
2.8 |
2.5 |
12.5 |
|
|
Percentage shares |
|||||||
|
Total |
100.0 |
495 |
271 |
54 |
108 |
72 |
|
|
Republic of Serbia |
100.0 |
78.5 |
4.2 |
2.3 |
9.4 |
5.6 |
|
|
central Serbia |
100.0 |
73.9 |
2.7 |
3.6 |
13.3 |
6.5 |
|
|
Vojvodina |
100.0 |
83.9 |
5.4 |
8.3 |
6.7 |
3.1 |
|
|
Kosovo & Metohia |
100.0 |
23.3 |
1.3 |
17.6 |
1.0 |
56.8 |
|
|
Croatia |
100.0 |
20.5 |
56.9 |
5.8 |
12.7 |
4.1 |
|
|
Macedonia |
100.0 |
17.9 |
3.6 |
16.1 |
4.3 |
58.1 |
|
|
Slovenia |
100.0 |
33.9 |
13.3 |
24.2 |
9.3 |
19.3 |
|
|
Montenegro |
100.0 |
21.0 |
4.3 |
8.6 |
15.2 |
50.9 |
|
 |
|
Fig. 3. - Migrant population in Bosnia
and Herzegovina according to place of birth and place of residence
Census of 1981 |
All of the above confirms the fact that the migrational trends of the Serbs from Bosnia and Herzegovina were towards Serbia and of the Croats towards Croatia. It should also be pointed out that the Muslims from all over the Balkans have been migrating to Bosnia. In the last decades, this was manifested by directing the youth from the municipalities of south-west Serbia and north-east Montenegro (Novi Pazar, Sjenica, Tutin, Nova Varoš, Rožaje, Ivangrad) to Sarajevo and other towns of Bosnia for educational and economic purposes. There have obviously been strong trends towards creating ethnically homogeneous regions in Yugoslavia where migrations do have a key role. This also includes factors such as physical mobility of the population from these regions not for economic or demographic reasons; the most important among them being cultural, psychological, and political reasons. The intense emigration of the Serbian and Croatian population in relation to the Muslim population and the immigration of the Muslims into Bosnia and Herzegovina in the course of the last few decades caused, together with the differences in the natural increase and the consequences of the earlier demographic trends, changes in the ethnic structure in the region after the sixties. The main characteristic is the strengthening of the Muslim population compared to the Serbian and Croatian population.
Still, rapid changes in the ethnic structure of the population of Bosnia and Herzegovina of the sixties, and particularly in the period 1961-1971, cannot be explained only by demographic conditions and factors. It is necessary to point to the evident impact of the political climate of the period, which made it possible for the Muslims to constitute themselves as a people, which had as a consequence a sudden increase in the count of the Muslims in Bosnia and Herzegovina in the period 1961-1971.
The changes in natural components of the population growth (birth rate, fertility, mortality, natural population increase) were slow in Bosnia and Herzegovina before the sixties. In the period 1951-1961, births per 1000 population went down from 33.9 to 32.8; deaths per 1000 population went down from 17.0 to 8.9. In the same period, the number of persons per 1000
population increased due to natural population increase from 16.9 to 23.9. In the sixties, the central and northern pares of Bosnia, the main characteristic of which was a high concentration of the Muslim population, had birth rates of 30.0%o (the districts of Zenica, Birčane even above 40.0%o). The parts of Herzegovina mostly inhabited by the Serbian population had birth rates below 25.0%o. After the sixties, the natural reproduction in Bosnia, and Herzegovina took a different course, and in the period 1971-1989, birth rates went down from 22.0%o to 14.1%o, and the natural increase rate from 15.4%o to 8.1%o. The expanded reproduction after World War II came down to a stable rate of reproduction in the seventies and after that down to the level of insufficient natural reproduction. This does not ensure normal natural reproduction of the population in Bosnia and Herzegovina.
The trends in natural reproduction of the population were very much different by nationalities. The natural reproduction more rapidly changed among the Serbs and Croats than among the Muslims. This is confirmed by some indicators of the natural trends of the population by nationalities. In 1953, in Bosnia and Herzegovina the birth rate of the Croatian population was 34.9%o, of the Serbian population 36.9%o, and of the Muslim population 45.8%o. In 1961, the birth rate of the Serbian population was 26.6%o, of the Croatian 33.9%o, and of the Muslim 40.6%o. Until 1981, the birth race of the Serbs went down to 14.8%o, of the Croats to 15.8%o, and of the Muslims to 21.0%o. In the period 1961-1981, changes in mortality rates of the Serbs were insignificant (7.2%o to 7.1%o), of the Croats (9.1%o to 6.9%o), and of the Muslims (11.1%o to 6.2%o). The above changes in birth and mortality rates led to changes in the natural increase of the Serbs, Croats, and Muslims in Bosnia and Herzegovina after World War II. In 1961, the natural increase rate was: Serbs 19.6%o, Croats 24.8%o, and Muslims 29.5%o. Until 1981, the natural increase of the Serbs went down to only 7.7%o, of the Croats to 8.9%o, and of the Muslims to 14.8%o. Birth rare, death rate, and natural increase rare and their changes by nationality in Bosnia and Herzegovina have resulted from the differences in the level and trend of natural reproduction and ageing in the last decades.
|
|
Serbs |
Croats |
Muslims |
|
Births per 1000 population |
|||
|
1961 |
26.6 |
33.9 |
40.6 |
|
1971 |
17.6 |
21.4 |
25.2 |
|
1981 |
14.8 |
15.8 |
21.0 |
|
Death per 1000 population |
|||
|
1961 |
7.2 |
9.1 |
11.1 |
|
1971 |
6.3 |
6.7 |
6.6 |
|
1981 |
7.1 |
6.9 |
6.2 |
|
Natural increase per 1000 population |
|||
|
1961 |
19.6 |
24.8 |
29.5 |
|
1971 |
11.3 |
14.7 |
18.6 |
|
1981 |
7.7 |
8.9 |
14.8 |
The above indicators and other measurements of reproduction of population signify the present differentiation in natural reproduction due to different demographic, economic, social, religious, and political factors in Bosnia and Herzegovina. This demographic phenomenon resulted in a very rapid growth due to natural reproduction of the Muslim population in relation to the Serbian and Croatian population in Bosnia and Herzegovina after World War II. So, in 1981, 39.5% Muslims gave births to 47.9% of the new-born infants (born alive), 32.0% Serbs to 28.1%, and 18.4% Croats to 16.9%. On the basis of this, after the seventies the Muslim population was for the first time predominant in number over the Serbian population, while the Serbs remained predominant in the ethnic structure of the population on the basis of other elements, such as settlements and territory.
The above changes in natural reproduction and mobility of the population and the consequences of the past demographic trends led to an intense regional and demographic polarisation in Bosnia and Herzegovina after World War II. The main feature of this polarisation was a distinct trend of population concentrating in central Bosnia, the most developed industrial and urban part of the republic, the most mixed region in terms of ethnic origin, with evident relative and absolute majority of the Muslim population. In the period 1948-1961 the average population increase rate in central Bosnia was 20.0%o to 40.0%o and over, in the period 1961-1981 it was 20.0%o to 30.0%o, and in the period 1981-1991 the population growth went down below 20.0%o. However, on the territory of Bosnia and Herzegovina on which the Serbian and Croatian population had absolute or relative majority the population increase rates were below 10.0%o even in the period 1948-1961. After the sixties, most of this region was under the process of critical loss of population with negative natural increase and a population loss. This was particularly the case with rural settlements since municipal centres and some other central settlements attracted the population that came by way of migrations.
The regional ethnodemographic polarisation of Bosnia and Herzegovina can be determined on the basis of the type of changes in the population count in some intercensal periods.
So, the population gain based on positive natural increase and positive migrational balance was characteristic of 15 municipalities in the period 1971-1981. Those were the municipalities in Sarajevo town, regional centres (Mostar, Banja Luka, Zenica) and the municipalities in their vicinity. At the same time, those were industrially the most developed regions in Bosnia and Herzegovina, and in the majority of them the Muslims had ethnic prevalence. The population gain based on positive natural increase and negative migrational balance was characteristic of about one half of the municipalities (55) in Bosnia and Herzegovina. Those were the parts of central, northern and north-west Bosnia mostly inhabited by the Muslim population and characterised by young age structure and high natural increase (Velika Kladuša, Cazin, Kotor Varoš, Zavidovići, Kalesija, for example). To this group belonged the municipalities inhabited by the Serbian or Croatian majority characteristic of noticeable emigration (Bihać, Prijedor, Doboj, Bijeljina, Jajce).
The population loss resulting from positive natural increase and negative migrational balance was characteristic of 33 municipalities of Bosnia and Herzegovina in the period 1971-1981. These were the highland municipalities of western Bosnia (Drvar, Bosansko Grahovo, Bosanski Petrovac, Livno, Glamoč, Kupres, Šipovo, Duvno, Mrkonjić Grad) inhabited by the Serbian or Croatian population; the municipalities of western Herzegovina inhabited by the Croatian population; the municipalities of eastern Herzegovina and partly eastern Bosnia inhabited mostly by the Serbian population. These were industrially rather underdeveloped regions of Bosnia and Herzegovina from which the population emigrated because of the poor economic development.
The scope and distribution of population loss in this region are evident in the data for the period 1948-1981, when the population decline took place in 2407 (or 40.8%) settlements out of the total number of 5888 settlements in Bosnia and Herzegovina. In this period, the share of the depopulated settlements in the total number of the settlements was lowest in central Bosnia (up to 20.0%) where the Muslim population were concentrated, and it was highest in the parts of western Bosnia and eastern Herzegovina where the Serbian population was concentrated (over 60.0% of the settlements).
The number and distribution of the overpopulated settlements can be seen in the contemporary trend of regional and geographical polarisation of Bosnia and Herzegovina. In the period 1971-1981, there were 2377 settlements (40.4% of the total number) in which the population increased. In 1981, 71,5% of the population was concentrated in these settlements. In terms of geographical distribution, the greatest share of the population in the overpopulated settlements in relation to the total population was in central Bosnia, in the part of Bosnian Posavina, and in the part of western Bosnia inhabited mostly by the Muslim population. In the regions mostly inhabited by the Serbian and Croatian population the percentage share of the population of the overpopulated settlements in relation to the total population was lower due to low reproduction, intense emigration and slow industrial and social transformation.
It can be concluded that strong reciprocal relations have existed between ethnodemographic and industrial development in Bosnia and Herzegovina in the past as well as today. The regions intensely losing population are the underdeveloped ones. The vast highland regions, inhabited mostly by the Serbian and Croatian population, did not get any considerable investments after World War II, their income sharing dropped and they had loss in population. On the other hand, central Bosnia inhabited mostly by the Muslim population was characteristic of the largest economic potentials. The ethnic area of the Muslims in Bosnia and Herzegovina had considerable advantages in terms of the attained level of industrial and social development over the ethnic area of the Serbs and Croats. This is one of the most important determinators of inter-ethnic clashes and future ethnic delimitation's.
From the middle of this century, a considerable transformation of demographic phenomena and processes occurred on the basis of political, economic, social and cultural changes in Yugoslavia, predetermining the structure of the population in Bosnia and Herzegovina. The population potentials and their geographical distribution will be defined according to the following data.
By the 1948 census, there were 2,565,277 persons in Bosnia and Herzegovina; in the span of 17 years (1931-1948), the increase in the count was only 241,722 persons, or 14,219 persons per year. This was a much slower increase than in the period 1921-1931 when the population of this region increased by a yearly average of 43,312 persons. In the period 1931-1948, the Orthodox population increased by 39,594 persons only or by an average of 2329 per year, while the increase in the period 1921-1931 was 19,885 persons per year as an average. In the period 1931-1948, the Muslim population increased by 172,885 persons or an average of 10,119 per year, which was insignificantly lower than the average yearly increase of the Muslims in the period 1921-1931 (12,983 persons). In the same period, the Catholic population increased in number by 33,022 persons or an average of 1942 per year, while the increase in the period 1921-1931 was 10,403 persons per year on average. These data should be compared to the total population potential in Bosnia and Herzegovina in 1948: Orthodox population 1,067,728 or 41.6%, Muslim population 890,094 or 34.7%, and Catholic population 580,970 or 22.6%. This confirms the fact that the Serbian population had greatest losses in Bosnia and Herzegovina in World War II, which affected its further demographic development. The Jews had also greatest losses which affected their demographic growth.
The 1948 census gives data on religious affiliation and national origin. According to these data it is evident that even though the Serbs had great losses in World War II and in the post-war period, they were still the most numerous in Bosnia and Herzegovina in 1948. There were 1,136,116 Serbs. Among them were 71,125 persons of the Muslim religion who declared themselves as Serbs by ethnic origin. Then, the Serbs comprised 44.4% of the population of Bosnia and Herzegovina. In the 1948 census, there were 788,403 undecided Muslims or 30.7% of the total population. The number of the Croats was 614,123 persons or 23.9% of the population, and among them were 24,914 persons of the Muslim affiliation who declared themselves as Croats. In 1948, with reference to the population distribution by republics, it is important to point out that 17.3% of the total number of the Serbs in Yugoslavia, 16.2% of the total number of the Croats, and 97.5% of the undecided Muslims lived in Bosnia and Herzegovina. The greatest number of those Muslims who declared themselves as Serbs, Croats, or other lived also in Bosnia and Herzegovina and their number was 97,286 from the total of 227,203 persons of the Muslim religion that declared themselves as other nationals. Besides, 4338 Slovenes, 3094 Montenegrins, 675 Macedonians lived in Bosnia and Herzegovina; the most numerous among the national minorities were Ruthenians and Ukrainians (7883 persons).
The distribution of the population according to regions did not significantly change from the earlier periods except that the relative share of the Serbian population dropped in the regions where they constituted the majority, and the relative share of the Muslim population increased in the regions in which they were ethnically predominant, in urban districts in particular. This was the consequence of the above mentioned losses of the Serbian population in wartime and in emigrations and of some internal relocations of the Muslim population towards urban centres. As in the earlier period, it is still evident that the Serbs comprise the majority (51% of the population and over) in some vast regions. These were the regions in western and north-west Bosnia (except for the Muslim enclave in the Cazin Krajina), in eastern Herzegovina, in some districts of the eastern and north-eastern Bosnia, and in the district of Sarajevo in central Bosnia. The Croats constituted majority in western Herzegovina and in several districts of central and northern Bosnia. The undecided Muslims comprised majority in some districts of central and north-east Bosnia (51% to 70% except in the district of Cazin). According to the 1948 census, the level of ethnic homogeneity of the settlements and territories of the Muslims in Bosnia and Herzegovina was lower in comparison with that of the Serbs and Croats. The Muslims were mixed with Serbs to a greater extent than with Croats.
According to religion, in 1948 the Orthodox population had absolute or relative majority in 31 districts, the Muslim population in 13 towns and 20 districts, and the Catholic population in 16 districts in Bosnia and Herzegovina. (Table 5)
By the 1953 census, the Serbian population was predominant in the ethnic structure of Bosnia and Herzegovina with 1,264,372 persons or 44.4%. Second in number were the Muslims with 891,800 persons or 31.3%, and there were 654,229 Croats or 23.0%. In 1953, Serbs, Croats and Muslims constituted 98.7% of the total population of Bosnia and Herzegovina. Also, there were 7336 Montenegrins, 6300 Slovenes, and 1884 Macedonians. In 1948-1953, a very rapid population growth was noticed in Romanies and Albanians. This resulted from an intense biological reproduction and their declaring in different ways. Then, the number of Romanies increased from 442 to 2297, and of Albanians from 755 to 1578. In terms of concentration of the Serbs, Croats, and Muslims in this Republic no significant changes occurred after 1948. In 1953, in Bosnia and Herzegovina lived 17.9% of the Serbian population, 16.5% of the Croatian population, and 89.3% of the Muslim population in Yugoslavia. (Table 5).
By the 1961 census, the Serbs were predominant in the total population in Bosnia and Herzegovina with 1,406,057 inhabitants or 42.9%. Second in number were the Muslims with 842,248 inhabitants or 25.7%, and there were 711,665 Croats or 21.7%. In the period 1953-1961, the Serbian population increased by 111.2 index points, the Croatian by 108.8 points, and the Muslim dropped by 94.4 points. The drop in absolute values and percentage share of the Muslim population was the consequence of the changes in the way how they declared themselves, and also to some extent due to emigrations to Turkey after the Balkan Agreement of 1953-54. In 1961, the Serbs, Muslims, and Croats comprised 90.3% of the population in Bosnia and Herzegovina, which means an increase in the shares of other nationalities. In this Republic, there were 18% of the total Serbian population in Yugoslavia, 16.6% of the Croatian, and 86.6% of the Muslim. The shares of other nationalities increased in the total population in Bosnia and Herzegovina except Slovenes. The number of Montenegrins went up from 7336 to 12,828 (74.9 index points). The number of Macedonians increased from 1884 to 2391 (126.9 index points), and the number of Slovenes went down from 6300 to 5939 (94.3 index points). The increase in the number of Albanians was evident (from 1578 to 3642 people - 230.8 index points) in the same way as the drop in the count of other national minorities that returned to their countries after World War II (Germans, Czechs, Poles, etc.). (Table 5)
By the 1971 census, 3,746,111 inhabitants lived in this Republic, by the 1981 census, 4,124,256, and by the 1991 census 4,364,574. The average yearly increase of the population was 46,816 persons in the period 1961-1971, 37,815 in the period 1971-1981, and only 24,032 in the period 1981-1991.
After 1960s considerable changes in the population dynamics by ethnic origin in Bosnia and Herzegovina occurred as a consequence of the above mentioned differences in mobility, natural reproduction of the population and the overall social and political conditions and factors, which made it possible for the Muslims to declare as a separate people.
For the first time in a long period, the main feature of the Serbian population was the population numerical decline when they lost the top place in the total population potentials in Bosnia and Herzegovina. In the period 1961-1971 the number of the Serbs m this Republic went down from 1,406,057 to 1,393,148 persons and up to 1981 to 1,320,644, which was 85,413 persons in 20 years. The 1991 census recorded an increase of the Serbian population, which was a. consequence of the fact that many people did not declare themselves as Yugoslavs in the new political circumstances. After the seventies, the Serbs were second in number in Bosnia and Herzegovina with the share of 37.2% in 1971, 32.0% in 1981, and 31.4% in 1991. According to the first results of the 1991 census, 16.1% of all the Serbs (8,526,872) in Yugoslavia lived in Bosnia and Herzegovina. This number of the Serbs and the tendency towards a decrease is a consequence of the total losses in World War II, continuous emigrations, then changes in natural reproduction, and the fact that a significant number of the Serbs declared themselves as Yugoslavs in the past few decades. (Table 5)
The growth of the Muslim population was rather rapid. In 1961: the count of the Muslim population was 842,248, in 1971: 1,482,430, in 1981: 1,629,924, and in 1991: 1,905,829. This was an increase of 1,063,581 inhabitants in the period 1961-1991 or 226.0 index points. The population doubled in 30 years. An intense natural reproduction and small changes within this process, low level of mobility, constant immigrations of the Muslim population from other parts of Yugoslavia and changes in the way of their declaring put this population at the top place, as regards the total population potential in Bosnia and Herzegovina from the 1970s. In 1971, the Muslims comprised 39.6%, in 1981 39.5%, and in 1991 43.7% of the total population of Bosnia and Herzegovina. According to the first results of the 1991 census, of those who declared themselves as Muslims in Yugoslavia, 83.5% lived in Bosnia and Herzegovina. (Table 5).
The growth of the Croatian population in Bosnia and Herzegovina was slower in comparison with the Muslim population, which was the consequence of the low level of natural reproduction and of intense emigrations in the decades after World War II. In the period 1961-1971, the Croatian population increased from 711,665 to 772,491 persons and then it started decreasing, so that in 1991 it was 755,895. The share of the Croatian population in the total population in Bosnia and Herzegovina dropped from 21.7% in 1961 to 17.3% in 1991. According to the first results of the 1991 census, 16.4% of all the Croats in Yugoslavia lived in Bosnia and Herzegovina. (Table 5)
Therefore, in 1961-1991, the total shares of the Serbian, Croatian, and Muslim population in the total population of Bosnia and Herzegovina increased from 90.3% to 92.4% though their population dynamics was rather different. However, only the number of the Montenegrins increased among other Yugoslav nationalities in Bosnia and Herzegovina. Thus, for the first twenty years of the period their count increased from 12,828 to 14,114 persons,(1 10.0 index pts), the share being equal to 0.3% of the total population in the Republic. At the same time, the number of the Slovenian and Macedonian population declined. The Slovenes decreased from 5939 to 2753 persons (46.5 index pts), and the number of the Macedonians from 2391 to 1892 (79.1 index pts). The most significant change in absolute values and the percentage share of other population was evident in the increase of the persons who declared themselves as Yugoslavs. They numbered 275,883 persons in 1961, 326,280 in 1981, and 239,847 in 1991. That equalled 8.4%, and 7.9%, and 5.5% of the total population of Bosnia and Herzegovina. Also, the number of the Romanies increased. In 1981 there were 7251 of them or 0.2% of the total population of the Republic. According to the post-war censuses, the oscillation in their number was a consequence of the way they declared themselves, their high level of natural reproduction and low level of mortality, as well as the intense natural increase. The Albanian population in Bosnia and Herzegovina increased from 3642 to 4392 persons (1961-1981) or 120.6 index points, which was a considerably slower growth in comparison with the Albanians in Kosovo and Metohia. (Table 5)
|
|
1948 |
1953 |
1961 |
1971 |
1981 |
1991 |
|
Total |
2,565,277 |
2,847,790 |
3,277,948 |
3.746,111 |
4,124.008 |
4,394,574 |
|
Montenegrins |
3,094 |
7,336 |
12,828 |
13,021 |
14,114 |
...* |
|
Croats |
614,123 |
654,229 |
711,665 |
772,491 |
758,136 |
755,895 |
|
Macedonian |
675 |
1,884 |
2,391 |
1,773 |
1,892 |
... |
|
Muslims** |
788,403 |
891,800 |
842,248 |
1,482,430 |
1,629,924 |
1,905,829 |
|
Slovenes |
4,338 |
6,300 |
5,939 |
4,053 |
2,753 |
... |
|
Serbs |
1,136,116 |
1,264,372 |
1,406,057 |
1,393,148 |
1,320,644 |
1,369,258 |
|
Declared Yugoslavs |
|
- |
275,883 |
43,796 |
326,280 |
239,845 |
|
Other |
18,528 |
21,869 |
20,937 |
35,399 |
67,265 |
93.747 |
|
Percentage shares |
||||||
|
TOTAL |
100.0 |
100.0 |
100.0 |
100.0 |
100.0 |
100.0 |
|
Montenegrins |
0.1 |
0.3 |
0.4 |
0.3 |
40.3 |
... |
|
Croats |
23.9 |
23.0 |
21.7 |
20.6 |
18.4 |
17.3 |
|
Macedonians |
0.0 |
0.1 |
0.1 |
0.0 |
0.0 |
... |
|
Muslims |
30.7 |
31.3 |
25.7 |
39.6 |
32.5 |
43.7 |
|
Slovenes |
0.2 |
0.2 |
0.2 |
0.1 |
0.1 |
... |
|
Serbs |
44.3 |
44.4 |
42.9 |
37.2 |
32.0 |
31.4 |
|
Declared Yugoslavs |
- |
- |
8.4 |
1.2 |
7.9 |
5.5 |
|
Other |
0.8 |
0.7 |
0.6 |
1.0 |
1.8 |
2.1 |
* No data available.
** In the earlier censuses this category was named in different ways. In 1948: Undecided Muslims, in 1953: Yugoslavs undecided, in 1961: Muslims as an ethnic group, in 1971: Muslims as a people.
It can be concluded that no particular changes in the regional distribution by nationalities occurred in Bosnia and Herzegovina in the course of the past few decades in comparison with the earlier periods. The Muslim population had absolute or relative majority in 46 or 42.2% municipalities in 1981 and in 53 or 48.6% in 1991. The Serbian population had absolute or relative majority in 40 or 36.7% municipalities in 1981 and in 36 or 33.0% in 1991. The Croatian population had absolute or relative majority in 23 or 21.1% municipalities in 1981 and in 19 or 17.4% in 1991. The absolute majority (50% of the population and over) the Muslims had in 35 municipalities in 1981 and in 37 in 1991; the Serbs in 32 municipalities in both censal years; and the Croats in 14 municipalities in 1981 and 13 in 1991. In urban settlements the Muslims had the absolute majority (50.0% and over) in 29 municipalities, the Serbs in 23 and the Croats in 9. In rural settlements, the Muslims had absolute majority in 33 municipalities, the Serbs in 32 and the Croats in 15. This confirms that the Muslims usually settled the towns and this has been the case throughout their history.
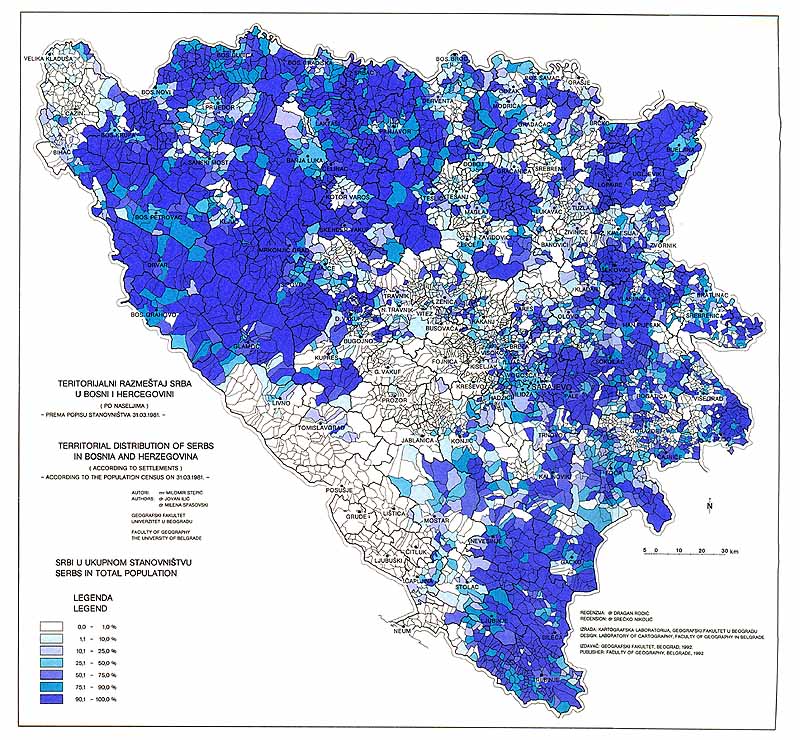
The population potential is not discussed only according to the count of inhabitants but according to households, settlements, territory. By the 1981 census, the Serbs had absolute majority (50.0% and over) in 2439 settlements or 41.4% settlements in the Republic. In 1795 or 69.9% of these settlements the ethnic homogeneity was very high (over 90.1% of the population). The settlements with 50.0% and more of the Serbian population covered the area of 27,255.2 km. sq., which accounted for 53.3% of the territory of Bosnia and Herzegovina in 1981.
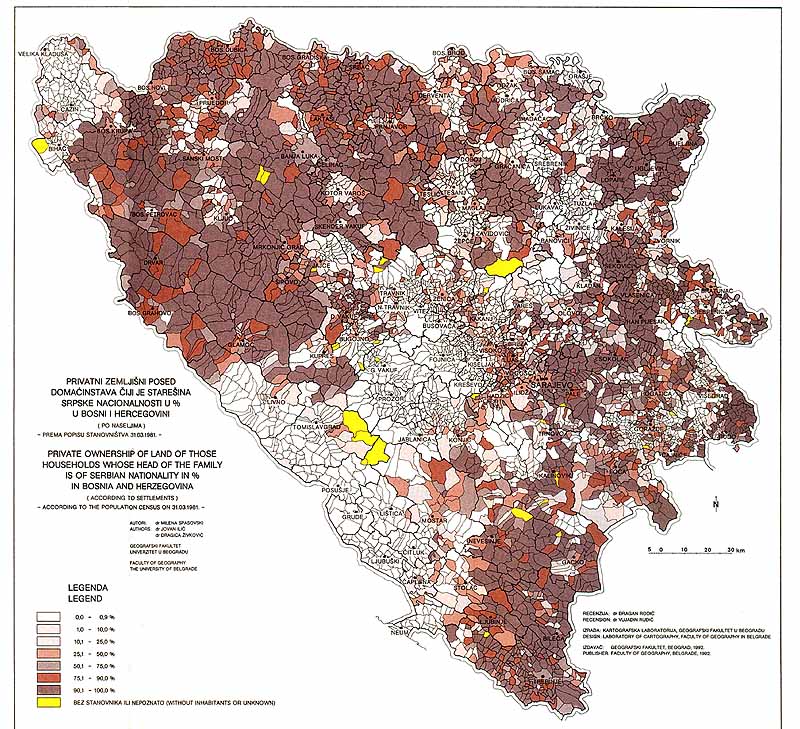
As long as the structure of private ownership of land is concerned, the households whose heads of families declared themselves as Serbs owned 51.4% of land in Bosnia and Herzegovina by the 1981 census. The share of the Serbian households in the structure of the private ownership of land was higher in the majority of settlements than the share of the Serbian population in the total population. Numerous settlements in which the Serbs did not comprise absolute majority contained households whose heads of families were the Serbs and owned more than 50.0% of private land. (See Map of Private Ownership...) This points to the fact that the Serbs with 1,320,644 inhabitants or 32.0% of the total population and 34.3% of the total number of households, keep the major place in the ethnic structure of Bosnia and Herzegovina today as it was also the case in the past.
In 1970s, the Muslim population was in prevalence in the total population potential in Bosnia and Herzegovina. This was due to their low mobility, the prevalence of immigration flows over emigration over a long period of time, slow acceptance of birth control methods, and to a long lasting expanded reproduction model after World War II. Certain social and political circumstances contributed to this situation as the Muslims were recognised the status of a people in the sixties. This was followed by the very incense growth of the Muslim population of 640,182 persons or 176.0 index points in the period 1961-1971. Owing to these circumstances, the Muslim population constituted numerical majority with 1,629,924 persons or 39.5% of the total population in Bosnia and Herzegovina in 1981.
In the same year the Muslims comprised the absolute majority (50.0% and more) in 2179 settlements or 37.0% of all the settlements in Bosnia and Herzegovina. A very high level of ethnic homogeneity (90.1 % and more) was found in 1264 settlements or 58.0% of all the ethnically homogeneous Muslim settlements in 1981. The territory in which the Muslims constituted majority is much smaller than the territory in which the Serbs predominated, and in 1981 it was 13,197.6 sq. km or 25.8% of the total area in Bosnia and Herzegovina.
By the 1981 census, the households whose heads of families declared themselves as Muslims owned only 27.3% of land in Bosnia and Herzegovina. This means that the Muslim households, which in 1981 accounted for 37.6% of all the households in Bosnia and Herzegovina, had much less land in private ownership than the Serbian households. The reason for this was the fact that the Muslim population concentrated in urban settlements and in lowland areas characterised by higher population density.
One of the characteristics of the Croatian population is much lower population potential compared to the Muslim and Serbian population in Bosnia and Herzegovina. It is important to mention very strong mobility in the past and today, then more frequent emigrations than immigrations (except in the period of the Austro-Hungarian rule) and insufficient natural reproduction of a later date. In 1981, the Croatian population numbered 758,136 persons or 18.4 % of the population. The Croats constituted absolute majority (50.0% and over) in 1016 or 17.3 % settlements. The ethnic homogeneity of the highest degree (90.1% and over) was recorded in 628 or 61.8% of all the settlements with the majority of the Croatian population. The area of these settlements covered 8,494.8 sq. km. namely 16.6% of the territory of Bosnia and Herzegovina.
In 1981 the households whose heads of families declared themselves as Croats accounted for 17.3% of all the households in Bosnia and Herzegovina and owned 17.7% of land.
In 1981, the Serbian population share in the total population of Bosnia and Herzegovina was 32.0%, while the Serbian households owned 51.4% of land, and the ethnically homogeneous Serbian settlements accounted for 41.4% of all the settlements, and covered 53.3% of the territory. The Muslim population share was 39.5%, their households owned 27.3% of land and the ethnically homogeneous Muslim settlements accounted for 37.0% of all the settlements and covered 25.8% of the total territory of Bosnia and Herzegovina.
It was recorded in the 1981 census that 223 settlements in Bosnia and Herzegovina had no absolute majority of either Serbs, Croats or Muslims (50.0% and over). These settlements covered the area of 1656.6 sq. km. or 3.2% of the territory. They had mixed ethnic structure mostly of the Muslim and Serbian population and less of the Muslim and Croatian population or other.
In some of these settlements the absolute ethnic majority was constituted of the persons who declared themselves as Yugoslavs, while the Montenegrins comprised ethnic majority in one settlement. This analysis was based on the planimetric operation from the map The Ethnic Structure of the Population by settlements in Bosnia and Herzegovina, March 31, 1981 census.
The geographical distribution of the Serbs, Muslims and Croats in Bosnia and Herzegovina reveals that there are spacious areas in which each nationality is in predominant majority and the regions where they are considerably mixed, Serbs and Muslims in particular.
Today, as well as in the past, the Serbian population constitutes the majority in the vast area of western and north-western Bosnia. This is the highland and pen-Pannonian region intersected by the valleys of the Bosna, Vrbas, and Una rivers which with Lika, Kordun, and Banija forms the Serbian ethnic area. Its formation started with the appearance of the Military Border. Another spacious area inhabited by the Serbian majority is eastern Herzegovina. In eastern and partly in central Bosnia the Serbian population is considerably mixed with the Muslim population though the majority of the Serbs inhabit the belt of the municipalities of Sarajevo, such as Pale, New Sarajevo, Stari Grad (Old town), then across the municipal territories of Sokolac and Han Pijesak to Šekovići. The Serbs constitute majority in the parts near the Drina river (Foča, Čajnice, Rudo), and in north-eastern Bosnia (municipalities of Bijeljina, Ugljevik, Polare, and other).
The Muslim population has the majority in central Bosnia and it is considerably mixed with the Serbian population in the eastern and north-eastern parts of central Bosnia, and with the Croatian population in the western and south-western parts of central Bosnia. Another spacious area inhabited by the Muslim population is eastern Bosnia where they are considerably mixed with the Serbian population. A very high level of ethnic homogeneity of the Muslim population is noticed in western Bosnia (the municipalities of Velika Kladuša, Cazin, and the parts of the municipalities of Bosanska Krupa and Bihać). This is a Muslim enclave within the vast Serbian region of Bosnian Krajina. The Muslims, Serbs, and Croats are considerably mixed in northern Bosnia (the municipalities of Gradačac, Gračanica, Srebrenik, Doboj, Tešanj, and other) as well as in the Neretva river valley in lower Herzegovina (the municipalities of Mostar and Čapljina). A very important feature of the distribution of the Muslim population is its considerably lower degree of ethnic homogeneity compared to the Serbian and Croatian population, as well as the more substantive territorial mixing of the Muslims and Serbs than of the Muslims and Croats.
The Croats predominate in western Herzegovina, which borders on the Croatian ethnic area in central Dalmatia. A very high level of ethnic homogeneity of the Croatian population is noticed here. In central Bosnia the Croatian population is considerably mixed with the Muslim population comprising majority there. Greater density of the Croatian population also exists in a number of municipalities of northern Bosnia (the Sava River valley near Šamac) where the Croatian population is mixed with the Serbian population. And, finally, there are small enclaves of the Croatian population within the vast region of western and northern Bosnia where the Serbian population prevails.
The territorial distribution of the persons who declare themselves as Yugoslavs correlates with the degree of economic and urban development of certain geographical entities in Bosnia and Herzegovina. According to the 1981 census 20.0% and more Yugoslavs out of the total population were enumerated in the municipalities of Sarajevo Centre and Sarajevo New Town. The municipalities of Banja Luka, Tuzla, and Sarajevo New Town had between 15.1% and 20.0% Yugoslavs. The share of Yugoslavs of 10.1% to 15.0% was found in 12 municipalities, in 8 of which the Serbian population had majority (Trebinje, Mostar, Bosansko Grahovo, Drvar, Bosanski Petrovac, Bihać, Bosanski Novi, Bosanska Dubica, Bosanska Gradiška, Bosanski Brod, Zenica, Ilidža). The share of the Yugoslavs of 5.1% to 10.0% was recorded in 29 municipalities in Bosnia and Herzegovina in 1981. In most of these municipalities situated mainly in northern Bosnia, the Serbian population had majority. The above data confirm the statement that the share of the Serbs in the number of the Yugoslavs is greater than that of other nationalities.
The analysed changes in the ethnic structure of the population on the territory of Bosnia and Herzegovina demonstrate its exceptionally complex ethnodemographic development in the past and today. The territorial distribution of the Serbian, Muslim and Croatian population in this area points to a considerable mixture and multiple links that have been created on this soil over the centuries.
However, through centuries-long life and development, vast areas gained specific ethnic identities of the predominant population in spire of the fact that administrative borders were dividing their ethnic area. An example of this can be found in the centuries-old administrative division of the Serbian ethnic area of Bosnian Krajina, Lika, Kordun and Banija between Bosnia and Herzegovina and Croatia, then of the Croatian ethnic area in western Herzegovina and central Dalmatia.
Through the recent processes of industrialisation and urbanisation, the ethnic permeating and mixing of the population are high, but the dominating ethnic features have been preserved in the regions with high degree of national homogeneity (western and north-west Bosnia, eastern and western Herzegovina, etc). Today, their ethnic identity is embodied in political and territorial organizing in the circumstances of disintegration of the Yugoslav state at the beginning of the 1990s.
By the recognition of Bosnia and Herzegovina as an independent state by the International community, the Serbian and Croatian ethnic areas were separated from their ethnic centres - Serbia and Croatia, which accelerated an inter-ethnic and religious war. In these circumstances political and territorial organising of the Serbs actually meant defending their ethnic area of at least 53% of the territory of Bosnia and Herzegovina and preventing the plan by which the Serbian people from the leading place in the ethnic structure were o become a national minority in "Greater Croatia" or "Islamic Bosnia and Herzegovina". It is a historical necessity to safeguard the essential Serbian national interest embodied in the union of all the Serbs into one state formed n 1918, after the three wars (Balkan Wars, World Wars I and II) in this century.
Having in mind long lasting historical trends, the essential Serbian national interest achieved by uniting all the Serbs and their ethnic area on the Balkan Peninsula, the right of the Croatian and Muslim populations to realise heir historical aspirations to create their national states, and having in mind these new horrible war events, it is obvious that the ethnic delimitation is the only way to stop bloodshed and make it possible for the Serbs, Croats, and Muslims to survive and live on this territory. This is an indispensable prerequisite to further demographic, economic, social, and civilisation development of the Serbian population on this territory, predominant in the structure of the population in Bosnia and Herzegovina since the settling of the Slavs on the Balkan Peninsula till today. If ethnic delimitation had been carried out in a peaceful way it would have meant enormous progress of civilisation. Unfortunately, the effects of war upon the demographic and other spheres of he future development in this area cannot be perceived yet.
1. Djordje Pejanović, Stanovništvo Bosne i Hercegovine /The Population in Bosnia and Herzegovina/ (Belgrade: SANU, 1955), p.39.
2. Ibid., pp. 46-50.
3. Ante Markotić, "Neka obeležja bosansko-hercegovačke medjurepubličke migracije," /Migrations.../ Pogledi na migracije stanovništva Jugoslavije (Belgrade: Institut društvenih nauka, 1990), pp. 137-139.
4. Ruža Petrović, Migracije u Jugoslaviji i etnički aspekt /Ethnic Aspects of Migrations in Yugoslavia/ (Belgrade: Izdavački Centar SSO Srbije, 1987), p.76.
5. Ibid., p.74.
6. Dubravka Velat, Stanovništvo Jugoslavije u posleratnom periodu /Population in Yugoslavia in the post-war Period/ (Belgrade: SZS, 1988), p. 141.
Dr Milena Spasovski is Associate Professor of Geography of Population and Demography at The Faculty of Geography, University of Belgrade. She has published about forty papers in Geography of Population and Demography in Serbian, English and Polish. She is the author of Prirodne komponente razvitka stanovništva Beograda /Natural Components of the Population Development of Belgrade/ (1977); Etnički sastav stanovništva Bosne i Hercegovine /The Ethnic Structure of the Population of Bosnia and Herzegovina/ (1992, with two co-authors). 'I he book has been translated in to Greek (third edition 1995). She has also contributed to monographs the following papers: Prirodne komponente razvitka stanovništva /Natural Components of the Population Development) (1990); Broj i razmeštaj Srba i Crnogoraca u socijalističkoj Federativnoj Republici Jugoslaviji posle drugog Svetskog Rata /Number and Distribution of Serbs and Montenegrins in the S.F.R.Y./(1993).
Milomir Stepić, Assistant at the Faculty of Geography, University of Belgrade, received his Masters degree from the same University. His area of research is Political Geography with a special emphasis on geopolitical processes in the Balkans and economic Geography. He has published a number of scientific papers concerning the boundaries, delimitation's and geopolitical interests in Southeast Europe, and the series of ethnic maps of Yugoslavia. He is one of the co-authors of Etnički sastav stanovništva Bosne i Hercegovine /The Ethnic Structure of the Population of Bosnia and Herzegovina/ (1992).
Dr Dragica Živković is Assistant Professor of Cartography at the Faculty of Geography, University of Belgrade. Her major area of research is Cartography. She has published about forty scientific and professional articles and is one of the co-authors of Etnički sastav stanovništva Bosne i Hercegovine /The Ethnic Structure of the Population of Bosnia and Herzegovina/ (1992).
// Projekat Rastko / Istorija //
[ Pretraga | Mapa Projekta | Kontakt | Pomoć ]