|
 |
Svetlana RadovanovićDemographic Growth and Ethnodemographic Changes in the Republic of SerbiaSource: The Serbian Questions in The Balkans, University of Belgrade, publisher - Faculty of Geography, Belgrade 1995.
Complex processes in the ethnodemographic growth in the Republic of Serbia could be continuously followed only from the time when the regular statistical research was organised. The most important statistical data are the data on the natural movements of population and the censuses. In today s Republic of Serbia the censuses were conducted at irregular intervals and in differing historical circumstances. So, an abundance of data derived from 36 population censuses in the period 1834-1991 (18 Serbian, 5 Austro-Hungarian, 5 Bulgarian, and 8 Yugoslav), though with different degrees of reliability, non-uniform identifications, and incomparability and scope, still presents a valuable source of information which we will use, by applying ethnostatistics, to briefly demonstrate the population growth, ethnic structure and changes in the ethnic structure of the population in Serbia. The censuses in Yugoslavia after World War II offered very meagre ethnostatistical data of restrictive distribution. Precise questions on the basis of which conclusions about the ethnic structure of the population in Serbia could be made were asked for the first time in the 1948 census. Some of the earlier censuses contained only the information on religion or the data both on religion and native language, which offered rather ambiguous results for the population in the territory of today's Serbia. Statistical Research on the Ethnic Structure of Population and the Changes in Serbia before World War I and between Two World WarsUntil the first proper count of the population in Serbia in 1834, only partial censuses for fiscal and army needs had been conducted. The censuses were carried our by registering in the lists (account books) only the males above 7 years of age who were obliged to pay the emperor's tax and all the married men who were obliged to pay the vizier's tax. It is not possible to make an objective estimate of the figures and ethnic composition of the population as the data were deliberately adjusted, so that the number of taxpaying heads for enlisting was diminished and thus "tributes requested from Serbia minimised"[1] The data in one of these account books show that on the eve of the Second Serbian Uprising, there were not more than 30,000 taxpaying heads in all of Belgrade pashadom. However, according to Milica Sentić, there were 553,000 inhabitants in Serbia in 1813, which shows a large disproportion between the number of the taxpaying heads and the total population.[2] Considering the account books to be more reliable after 1820, because the historical circumstances in Serbia were somewhat more stable, a well known Serbian statistician Vladimir Jakšić estimated that the number of Christians in Belgrade in 1820 was 4500, and in 1828, it was 5500, He also considered that from 1820 to 1846 "the number of Christians in Belgrade could be twice that number in 1846-54, the same principle probably was true for the whole country,"[3] Ten censuses were carried out in the Principality of Serbia in the period 1834-1874. In the course of this period, the number of inhabitants increased from 678,192 to 1,359,890, which means that it almost doubled in 40 years. Table 1. Population Trends in the Principality of Serbia 1834-1874[4]
The censuses before 1866 did not cover all ethnic groups. The Turks were not registered. The data on the Gypsies were either incomplete and unreliable (as in the 1834 and 1850 censuses) or the Gypsies were counted, but only "those who had permanent residence, not the ones that conducted the life of vagrants" (as in 1854)[5]. Having studied all of the bibliographic sources available, Vladimir Stipetić made the following estimates on the number of the Turks and Gypsies in Serbia from 1834 to 1866: Table 2 Total Population and Estimated Number of the Turks and Gypsies in Serbia from 1834 to 1866[6]
*In the last column, the numbers are rounded up to thousand for approximation purposes. A significant drop in the number of Turks can be noted, which is understandable as Serbia was becoming more independent and the Sultan's edict of 1833 stated that the Turks had only five years to move out. It is important to mention major differences in the proportions of town and rural populations in the total population in the Principality of Serbia as well as the essential difference in the ethnic and confessional structure. The village population were almost completely Serbian, and the town population were small in number and extremely heterogeneous. Thus, in 1834 the town population constituted only 6.5%, and in 1859 only 8% of the population. Conducting the statistical research of Belgrade, Vladimir Jakšić took the numbers of births and marriages from the 1846 and 1854 census returns and estimated that in Belgrade "in every 100 inhabitants, 82 were of Orthodox confession, 10 Jewish, 5 Catholic, 2 Protestant, and one Mohammedan, but there were no Turks."[7] Namely, the 1854 census shows that in Belgrade "out of all the people of Christian faith: there were 13,760 Orthodox, 900 Catholics and 250 Protestants."[8] The confessional-ethnic composition in Belgrade was not much changed in 1874, when of all the population in Belgrade, there were 17.9% of "alien faith" (unorthodox) or 4945 inhabitants: 10.1% Catholics, 1.3% Protestants, 6.4% followers of Moses (Jews), and 0.1% Mohammedans.[9] With 27,605 inhabitants, Belgrade had only 2% of the total population in Serbia. For the first time in Serbia,, the question on nationality was asked in the 1866 population census. The wording of this question is not known to us not if there was any instruction about how to answer it, but "obviously, the goal was clearly defined: to determine for each inhabitant if he were of the Vlach, Gypsy or any other non-Serbian nationality."[10] The census returns show that at that time there were 1,216,348 inhabitants in Serbia: 10.5% Vlachs, 2.1% Gypsies, and 0.4% of other nationalities. If we accept this estimate by Jakšić, which should be trusted, then we may conclude that the confessional-ethnic picture in Serbia in 1866 did not essentially differ from the preceding one. By the 1878 Berlin Treaty, the districts of Nis, Pirot, Vranje, and Toplica were attached to Serbia and its territory was augmented from 37,511 sq. km. to 48,303 sq. km. The 1879 regional population census, which was conducted only in the newly attached territories for economy reasons, enumerated the following number of inhabitants: Table 3 Number of Inhabitants in the Newly Attached Districts in Serbia m 1879[11]
Each time the Serbian territory was enlarged (1822, 1878, and 1912/13) people would start migrating, which influenced the numerical and ethnic potentiality of the Serbian population, particularly in the newly attached districts. The population migrated from the regions under the Turkish administration to Serbia. "At the time of Prince Miloš's rule, in 1835 and 1836, numerous emigrants from the Banjaluka Krajina came to Lešnica, Lipnica and Loznica, the villages around Loznica and to Šabac."[12] After an insurrection in the surroundings of Niš had been crushed in 1841 "about 10,000 souls fled to Serbia", and after the failure of the 1875 uprising in the Pljevlja area, mass emigration took place around Pljevlja in the direction of Užice, Valjevo and the Drina river basin.[13] In 1878, the Albanians started moving out on a mass scale from the attached districts, mostly from Toplica, and settled the Lab river valley, Kosovo & Metohia, thus increasing the number of Albanians in those regions. Several thousands of Montenegrins also migrated to Serbia in 1890 because of famine and poverty, which is interesting because it shows that economic reasons were also the cause of immigrations into Serbia. From 1884 to 1910, six censuses were conducted in the Kingdom of Serbia. None of them contained the question on nationality, but each had questions on native language and religion. The Austro-Hungarian population censuses in Vojvodina from 1880 till 1910 did not contain the question on native language but on the language of communication, which was understood to be the language used by a person in everyday communication. For this reason it would be lather difficult to use these answers for deciding on a particular ethnic identity. According to Turkish yearbooks, in 1901, the Kosovo vilayet which encompassed five sanjaks: Skopje, Priština, Prizren, Novi Pazar, and Pljevlja had 964,657 inhabitants; two thirds were the Muslims and one child the Christians. The Muslims were primarily Albanians and the Christians were mostly Serbs. The yearbooks, however, cannot be taken as reliable sources of information "as in some districts, the female population were not registered, but were balanced against the male population, though it is a well known fact that the number of male heads exceeded the number of female heads throughout this period not only in those lands but in Serbia Proper as well."[14] On the basis of the Serbian, Austro-Hungarian and Bulgarian population censuses data (the results of the Bulgarian censuses were taken for the districts attached to Serbia by the Treaty of Neuilly,[15] the number of migrating inhabitants was derived for the territory of today's Republic of Serbia in the period 1880-1910. The marked growth in the number of inhabitants in the Principality, that is, the Kingdom of Serbia, is the consequence of the natural and migration components. Milovan Radovanović is of the opinion that "in spite of great differences in the characteristics of the natural movements of the population and the migration dynamics between the regions within Serbia, predominant is the share of the natural component, though in general, this component did not dominate over the migration component, especially if this ratio is considered by periods."[16] Table 4 Population of Serbia 1880-1910[17]
The conclusions about what the national structure of the population in Serbia in 1910 looked like can only be derived indirectly from the preliminary results of the 1910 census and that only for certain sections for which such data could have been derived. Thus, of the 100 inhabitants residing in Northern Serbia, 99.0% were of Orthodox faith, 0.3% of Roman Catholic, 0.5% of Muslim, and 0.2% were Israelites (Northern Serbia is today s Central Serbia, the territory of the Republic of Serbia without Vojvodina and Kosovo & Metohia). The difference by religion between the 1910 and 1921 censuses is only 1.1%, which "confirms the fact that the religions have preserved almost the same numbers of their adherents."[18] Also, in 1910, there were 95.4% inhabitants of the Serbian native language in Northern Serbia, "while in 1921, 93.4% inhabitants declared the Serbian or Croatian and Slovene languages as their native languages."[19] One should bear in mind that in Northern Serbia the number of inhabitants in 1921 was smaller by 10.9% or by 316,271 persons than in 1910. Actual demographic losses are estimated to be much greater, "over 811,000 war victims."[20] They tend to be even greater if the fact that the demographic development was deeply disrupted is taken into account; according to some computations, the population losses then increase to 1,511,435 persons, including the disabled.[21] In the first Yugoslav census in 1921, the question on nationality was not asked and the ethnic structure could only be determined indirectly by using the answers in the sections on native language and religion. Therefore, these data allow us to draw conclusions about the ethnic structure in the territory of the Republic of Serbia only to a certain extent, on the understanding that the comparisons are not possible for the Macedonians and the Montenegrins though both identities have been taken into account. Table 5 Population of Serbia by Religion and Native Language in 1921[22]
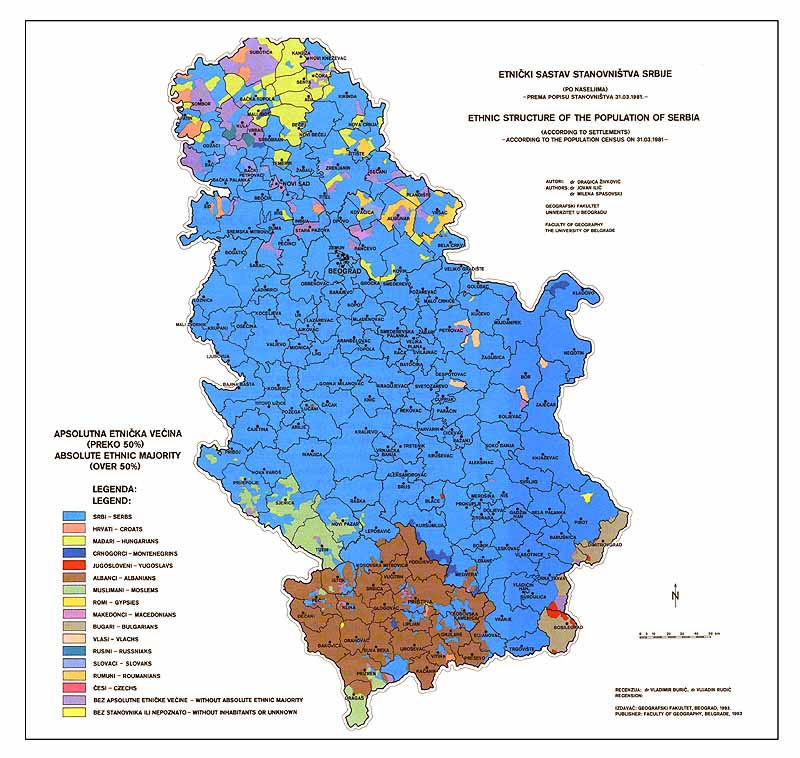
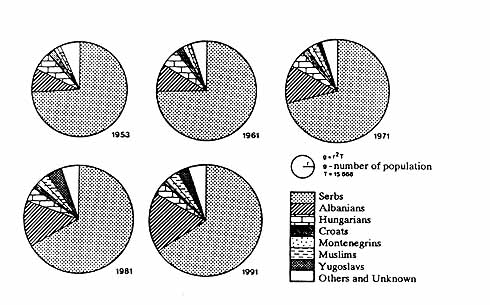
*The difference up to "total" is filled by "others" and "unknown". The above data lead to a conclusion that in 1921 more than two thirds of inhabitants in Serbia were of Orthodox religion. In Kosovo & Metohia, the Muslims constituted 75% of the total population, but 65.8% spoke the Albanian language and 6.4% spoke the Turkish language. From the total population in Vojvodina, about one half spoke Hungarian or German (24.3% Hungarian, 22.0% German), while Serbian or Croatian was spoken by 43%. The 1931 census contained the question on nationality, but it did not provide a true picture of the ethnic structure as all the Yugoslav nationalities were declared as one "Yugoslav". The data on nationalities were not published anywhere and the combined information on native language and religion continued to bear the same constraints as in 1921. Ethnic Composition of the Population and Ethnonational Changes after World War IIA realistic picture of the national composition of the population in Yugoslavia and in the Republic of Serbia can be obtained only from the post-war population censuses as these provide the data on national identity, which were collected in the circumstances of free national determination and subjective criteria. When we mention the "realistic picture" of the national composition, it should be stressed that the picture and/or the composition is above all the result of the national policy in the post-war socialist Yugoslavia. As regards the classification of the nationalities, the censuses between 1961 and 1991 somewhat differed from the 1948 and 1953 censuses though all the ethnic identities were congruent in principle. Namely, the 1961 census contained a little more detailed explanation of the term - "Muslim"; it indicated ethnic not religious affiliation. The answer to this question in the census could have been entered by all the persons of the Yugoslav origin who had no religion (!) if they deemed to belong to such an ethnic group. However, in the 1948 census, the Muslim category received a special treatment; they were considered to be Yugoslavs who could declare themselves as Serbs-Muslims, Croats-Muslims, Macedonians-Muslims and undecided Muslims.[23] The 1953 census abolished the category of Muslims - Yugoslavs and introduced the category of Yugoslavs - undecided. It is obvious that this latter category was mostly comprised of Muslims-Yugoslavs, just as it was the case in the 1948 census. This is evident in the demographic growth of the undecided Yugoslavs category in the period 1948-1953 though there is a reason to assume that in 1953, besides Muslims, this category involved a certain number of other ethnic groups. In other words, until 1961 the Yugoslavs practically covered mostly the Yugoslav Muslim population. After 1961, the Muslims started to consolidate on ethnic basis and develop into a nation. When required to register in 1961, a large number of people became rather confused trying to establish whether they belonged to this new ethnic category by religion and civilisation. Thus, in comparison with the 1953 census, the 1961 census showed absolute and real drop in the number of Muslims in Yugoslavia. It should not be overlooked that a portion of the Muslims emigrated to Turkey propped by favourable political circumstances at the time of the Balkan agreement. - the Alliance between Yugoslavia, Greece, and Turkey (February 28, 1953, in Ankara and the Contract, August 8, 1954, ac Bled). However, we consider the impact of this political block-wise factor to be of secondary importance for the Ethnodemographic process discussed in this paper. Therefore, the Muslim ethnic consolidation process took place over a comparatively short period of twenty-odd years (1961-1981); the turning point occurred in the first decade (1961-1971) when the number of persons declaring themselves as Muslims increased by 77.8%. From 1971, the Ethnodemographic development of the Muslims took its usual course which is evident in their numbers in the period 1971-1981. According to the classification method applied in the 1971, 1981, and 1991 censuses, the nationally decided persons were registered in alphabetical order: the first on the list were the peoples of Yugoslavia (Muslims were treated as a people), then the nationalities (national minorities) and other. The above considerations give room for the following conclusions: 1) before 1961, the category of Yugoslavs was most closely related to the category of Muslims - Yugoslavs from the 1948 census and to the category of Yugoslavs undecided from the 1953 census; 2) after 1961, the category of Yugoslavs almost completely lost its earlier ethnonational and civilisation meaning and acquired the identity of a floating population. In earlier stages of the national policy, this population was given a certain chance to constitute, but then they lost every opportunity to consolidate on ethnonational basis. In all the censuses from 1961 to 1981, the Yugoslavs were placed in the "nationally undecided" category. According to the classification applied in the 1971 and 1981 censuses, the population was divided in two main groups: "nationally declared" and "nationally undeclared". The nationally undeclared were subdivided into three groups: 1) undeclared, 2) declared as "Yugoslavs" 3) declared in the sense of regional affiliation. So, declaring oneself as a "Yugoslav" did not understand that one declared one's national affiliation. Therefore, "Yugoslavs" in the 1991 census were classified in the category of nationally declared. There was an explanation that in the classification the "Yugoslavs" will be placed after the category of people, but before nationalities. The explanation was given without any further details and interpretation of the term "Yugoslav". Bearing all of the above in mind, we will show the national composition of the population in the Republic of Serbia using the results from all the censuses from 1948 to 1991, on the understanding that the data for 1991 are preliminary as the census did not cover the Albanian population in Kosovo & Metohia because of the boycott of the Albanian alternative movement. In such circumstances, the total number of inhabitants in this Region and its national composition were computed on the grounds of the estimates made in the Regional and Republic Institutes of Statistics. The multinational composition of the population is characteristic of all of the territory of Yugoslavia; members of national minorities coexist with adherents of the Yugoslav peoples. According to the 1981 census, 82% of the total population in Yugoslavia were members of the Yugoslav peoples, 12% members belonging to the peoples whose homelands were outside the boundaries of the S.F.R.Y, and 6% of the nationally undeclared population. The Republic of Serbia, in which 36% of the total population in Yugoslavia lived in 1981, is the republic with the least homogeneous ethnic structure and the largest shares of national minorities coexisting with the Yugoslav peoples (77% of all the national minorities in Yugoslavia). The territorial distribution of the population in Yugoslavia by nationalities and the concentrations of different nationalities by republics show that the members of some peoples mostly concentrate in their home republics. The concentration is noticed to be comparatively highest in the Slovenes (97.7%) and Macedonians (95.5%), while the concentrations of the Muslims (81.5%), Croats (78%), Serbs (75.9%) and Montenegrins (69.2%) vary from 81.5% to 69.2%. The concentration of the most numerous national minorities and ethnic groups is highest in the autonomous regions of the Republic of Serbia. In Vojvodina live 93.3% of the total number of all Hungarians residing in Yugoslavia, 86.6% of the total number of the Slovaks, 86.1% of the total number of the Romanians, 82.9% of the total number of the Ruthenians, 91.4% of the total number of the Bunjevci and Šokci. In Kosovo & Metohia live 71% of the total number of all the Albanians living in Yugoslavia, while on the territory of Central Serbia reside 85% of the total number of Bulgarians and 80% of the total number of Vlachs. The majority of Romanies, 66%, live in Serbia, of whom 34% live in the territory of Central Serbia, 12% in Vojvodina and 20% in Kosovo & Metohia. In the Republic of Serbia the Serbs comprise the majority of the population. According to the first results of the 1991 census, their share amounts to 65.6% of the total population in the Republic. Albanians are in the second place with 17.2%, followed by Hungarians with 3.5%, Muslims with 2.4%, Montenegrins with 1.4% and Croats with 1.1%; 3.2% of the population in Serbia declared themselves as Yugoslavs."[24]
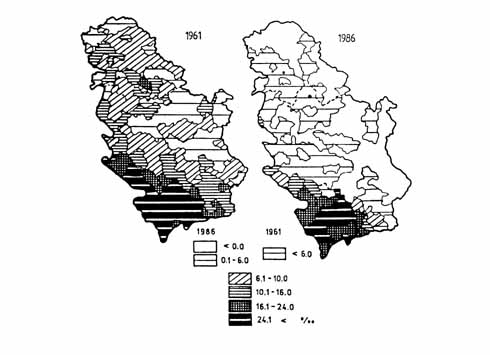
In 1991, in the territory of Central Serbia, the share of Serbs was 87.3%, Muslims 3.0%, Albanians 1.3%, Montenegrins 1.3%, and Romanies 1.2%, while 2.5% of the population declared themselves as Yugoslavs. The share of others was less than 1.0% each (Croats, Slovenes, Bulgarians, Vlachs, etc.). In the Autonomous Region of Vojvodina, the majority was comprised by Serbs (57.3%), then Hungarians (16.9%), Croats (3.7%), Slovaks (3.2%), Montenegrins (2.2%), Romanians (1.9%), Romanies (1.2%), and Bunjevci (1.1%), while 8.4% of the population declared themselves as Yugoslavs. In the Autonomous Region of Kosovo & Metohia the Albanians comprised the majority of the population (82.2% by 1991 estimate); Serbs took the second place with 10% and then followed Muslims (2.9%), Romanies (2.2%) and Montenegrins (1.0%). The shares of Turks and Croats were below one percent each, while the share of Yugoslavs was practically insignificant (0.2%). The results of all the post-war population censuses (1948-1991) show that the population in the Republic of Serbia increased by 49.9% in that period. However, major differences in the growth rates are noticed in the large territorial entities (Central Serbia, Vojvodina, Kosovo and Metohia). These differences in the population growth rates were caused by the drop of the share of the population from Central Serbia and Vojvodina, and the increase in the share of the population from Kosovo & Metohia in the total population of the Republic of Serbia. Thus, Central Serbia, the largest and most populated entity, had over 60% of the population in Serbia before 1991; in the period 1948-1971, its population participated with 58% in the total population growth in the Republic of Serbia and with 42.6% in the period 1971-1991. Vojvodina, which had 2.2 times more population than Kosovo & Metohia in 1948 and comprised one quarter of the total population of Serbia, had the share of 15% in the absolute growth between 1948 and 1971, and only 4.4% in the period 1971-1991. This means that in 1991, the numerical prevalence of the Vojvodina population (907,723 in 1948) over the Kosovo & Metohia population was reduced to only 57,770 persons, which was slightly above the annual natural population growth in Kosovo & Metohia in 1990. The share of the population of Kosovo & Metohia in the total population in the Republic of Serbia in 1991 almost equalled that of Vojvodina (Kosovo & Metohia 20.0%, Vojvodina 20.6%); 53.0% of the total absolute population growth in the Republic of Serbia could be ascribed to the population growth in Kosovo & Metohia in 1971-1991. Natural Component in Ethnodemographic Processes in the Republic of SerbiaLarge regional differences in the local population growth in the Republic of Serbia resulted, above all, from the natural population growth. In Central Serbia, in the period 1981-1990, in comparison with the preceding decade the natural population growth was halved; it dropped from 330,671 to 164,797. In Vojvodina this growth was by five times smaller in the last decade compared to the period 1971-1980; in the period 1971-1980 it was 69,885 and in the period 1981-1990 only 13,697. Contrary to this declining trend in the natural population growth in Central Serbia and Vojvodina, the population in Kosovo & Metohia in the post-war period has been characteristic of a particularly high natural growth. The natural increase rates in this Region were as follows: 29.1%o in 1950; 29.3%o in 1971; 24.1%o in 1981; 23.8%o in 1990; these numerical values are misleading as regards the drop in the absolute values of the natural increase rates. The actual situation was completely different. The absolute numbers show that the natural population growth in Kosovo & Metohia was 394,124 in the period 1971-1980 and 429,157 in the period 1981-1990. For this reason and the fact that the natural increase rates in Central Serbia and Vojvodina dropped, the share of the natural growth in Kosovo & Metohia in the total natural increase in the Republic of Serbia increased from 49.6% in the period 1971-1980 to 70.6% in the period 1981-1990.
When the growth in the number of inhabitants by macroentities in the Republic of Serbia is considered, it seems to be highly uneven; thus, it becomes important to review the growth of different nationalities, namely the differences in the shares of nationalities in the total absolute growth of the population in the Republic. Table 6 Absolute Population Growth by Nationalities in the Republic of Serbia in 1948-1971 and m 1971-1991[25, 26]
*) Preliminary results of the 1991 census **) The balance to "total" is comprised of "all other" and "unknown" The considerable drop in the shares of all nationalities except Albanians in the absolute population growth in the Republic of Serbia can be, above all, attributed to the significant drop in the natural increase of the Serbs and Croats and the negative natural increase of the Croats and Hungarians, which was particularly striking in the period 1981-1991. The shares of the nationalities n the total absolute population growth changed. The Albanians who comprised 11.7% of the total population in the Republic of Serbia in 1971 and 17.2% in 1991, in the period of 1971-1991 accounted for more than one half of the absolute growth in the Republic, while the Serbs, who in the whole lost-war growth comprised more than 60% of the total population in Serbia, had the share of 30.6% in the absolute growth in the Republic in the same period. For example, it is interesting to note that the natural increase of the Albanians in Kosovo & Metohia of 42,027 in 1990 was more than twenty times higher than the natural increase of all the Serbs and Montenegrins in the republic of Serbia, which was 2055 in that year. It was even three times higher than the natural increase of the total population in Vojvodina in the period 1981-1990, which was 13,679 for this ten-year period. The alarming drop in the bioreproduction of the Serbs and Montenegrins in Central Serbia and Vojvodina is attested by the fact that in 1990 the natural population increase n Central Serbia was only 908, in Vojvodina-1007, and in Kosovo & Metohia 2154, which means that the very small but positive natural increase of the Serbs and Montenegrins in the Republic of 2055 mostly resulted from their biological reproduction in Kosovo & Metohia! Bearing this huge disproportion in mind, it should be particularly emphasised that the increase of 908 heads is related to he Serbian-Montenegrin population in Central Serbia of 5,157,024 inhabitants and has the relative value of 0.2%o, while in Kosovo & Metohia the natural increase rate of the same population was 10.0%, with the absolute number 2154 related to the total of 215,346 Serbs and Montenegrins.
As the natural population increase is the main component of the population growth, it is necessary to point out that, due to low and declining natality, the natural increase share in the growth of the Serbian, Montenegrin, and even Muslim nationalities will be continually downwards. On the other hand, the share of the natural growth in the rapidly growing Albanian population will become a decisive factor in determining the share of the population of Kosovo and Metohia in the total population of the Republic of Serbia, and also in changing the national structure of the population in the Republic. Slike4,5,6
Migration Component in Ethnodemographic Processes in the Republic of SerbiaThe migration element which causes changes in the total population, demographic growth or decline, territorial redistribution, and national structure in the ethnically heterogeneous environments in the Republic of Serbia has a special importance and differs in character as it is closely related to social economic, ethnic and political processes. Yugoslav and European scientific circles are aware of the fact that the Serbian sources for studying complex migration phenomena, most successfully dealt with in the unique edition Settlements and Origins of the Population by the Serbian Academy of Sciences and Arts (the former Serbian Royal Academy), represent excellent scientific and cultural heritage compiled in the first place by Jovan Cvijic. The classification and integration of this enormous heritage has not been completed yet, but serious endeavours are undertaken by the Geographical Institute "Jovan Cvijic," the Serbian Academy of Sciences and Arts, and the Faculty of Geography of the University of Belgrade to successfully complete this task within their current research project. On the other hand, the statistical research of migrations is of a later date and is generally related to the population censuses. Without further discussing the methodology and other matters of the statistical research of migrations, which some authors[27] consider modest and inadequate, we will stress here the undisputed fact chat, in spite of some shortcomings, the statistical sources of this type give a satisfactory basis for understanding contemporary migrations within the Republic of Serbia and between Serbia and other (now former) Yugoslav Republics. In the period 1961-1981, the Republic of Serbia had a positive balance of migration of 145,475 persons in relation to all of the republics ex<ept Slovenia. In this balance of migration, Bosnia and Herzegovina occupied the top position with 71.8% and was followed by Croatia, Montenegro, and Macedonia. The Serbs, Montenegrins, and Macedonians had positive balances of migration, the Serbian share being 129,418 or 89.0%. The high degree of relative homogeneity of the national identity in the migrations between the republics is particularly noticeable in the balance of migration with Bosnia and Herzegovina in which the Serbs participated with 90.8%. These migrations were significantly different in character and intensity of the total migration as well as in the shares of individual ethnonational groups. Thus, Central Serbia had a positive balance of 86,932 with Kosovo & Metohia and Vojvodina in which the southern Region had a share of 86.2%. This means that Kosovo & Metohia had a negative balance of migration of-71,834 with Central Serbia, in which the Serbs participated with 80.8%, Montenegrins with 11.2%, and Muslims with 2.7%; the Croats, Macedonians, Slovenes, Hungarians, and "all other" also had negative balances of migration, while only the Albanians had a net gain in the absolute number of 2503. Central Serbia also had a gain with Vojvodina where the Serbs comprised 47.1%, Montenegrins 10%, Croats 4.1%, Macedonians 3.2%, Hungarians 3.8%, Slovenes 0.3%, other 32.5%, while only the Albanians had a net loss of-0.6%. Vojvodina had an overall net loss in the balance of migration of -9873 due to its negative balance of-15,098 with Central Serbia, which was somewhat alleviated by the gain in migration of 5225 with Kosovo and Metohia. Finally, Kosovo and Metohia had a high net loss of-77,059 of which -71,834 or 93.2% in favour of Central Serbia and -5225 or 6.8% in favour of Vojvodina. This southern Region had negative balances of migration for all the nationalities and the groups "all other" and "unknown" except for the Albanians, whose total net gain was 2503 with Central Serbia, and 504 with Vojvodina. The Serbs participated with -79.6%, Montenegrins with -11.2%, Muslims with -2.9% etc. The causes of such mass migration and exodus of the Serbs and Montenegrins are well known and it is not necessary to discuss this matter here. Nevertheless, we must note that the emigration process of the members of these two peoples of the same origin has not settled yet and that the pompously announced programme of the return to Kosovo & Metohia in the preceding years did not give desired results. We also stress that in calculating the balance of migrations for the Republic of Serbia, the 1991 census was not taken into consideration since the first preliminary results did not contain any results of the kind not could there be any because of the mass Albanian boycott of the census. The balance of migration for Central Serbia essentially differs from the total values for the Republic of Serbia. The absolute migration balance in the central part of the Republic is 178,735 (342,845 persons moved in, 164,110 moved out); the interrepublic migrations participated in it with 91,803 or 51.4%, and the intrarepublic (the balance of migration with Vojvodina and Kosovo & Metohia) participated with 86,932 or 48.6%. In the ethnonational structure, the balance of migration with Bosnia and Herzegovina is positive for all ethnic entities except for the Muslims, and the share of Serbs is 43,562 or 88.9%. Central Serbia has also a net gain with Croatia of 29,092, the Serbs being represented with 24,348 or 83.7%, while negative values apply to the Muslims, Slovenes, and Albanians. The balance of migration with Macedonia is positive but not high (6990 only); Macedonians predominate with 74.8% and Serbs with 43.1%. The sum of positive relative numbers exceeds 100.0 due to exceptional net loss on the part of the Muslims of -2487 and Albanians -1305. In this way, Slovenia is the only state-republic in favour of which Central Serbia has a net migration loss -4982, the Serbs participating with -3715 and Slovenes with -1147; only the Montenegrins and Macedonians have positive balances of migration. In the total positive intrarepublic balance of migration of 86,932, Kosovo & Metohia participate with 71,834 or 82.6% and Vojvodina with 15,098 or 17.4%. Finally, we will mention that in the overall balance of migration in Central Serbia, the Serbs participate with 130,975 or 73.3%, Montenegrins with 23,657 or 13.2%, Macedonians with 6523 or 3.6%, Croats with 2153 or 1.2%, Hungarians with 625 or 0.3%, and all others with 23,036 or 12.9%, while the Muslims have a net loss of-3422, Slovenes -868, and Albanians -3944. Vojvodina has a total migration gain of 58,581 (181,23 8 persons moved in, 122,657 moved out). With other republics outside Serbia, Vojvodina has a balance of 68,454 of which 5225 with Kosovo & Metohia and a negative value of-15,098 with Central Serbia. In the interrepublic balance of migration, Vojvodina has a migration loss of-2004 with Slovenia; all ethnonational groups have negative balances except the Albanians who had +7. In the balance of migration with other republics, the Serbs are the predominant group with 67,944, while the Hungarians have the largest net loss of-870. In the negative balance with Central Serbia (-15,098) the Serbs have the highest negative share of-7117 or -47.1% and Montenegrins of-1504 or -10.0%, then Croats with -616 or -4.1%, Hungarians with -579 or -3.8% and Macedonians with -490 or -3.2%. The group "all other and unknown" has a strikingly high net loss of -4909 or -32.5%, while only the Albanians have a positive value of 96. Vojvodina has a positive balance of 5225 with Kosovo & Metohia; the Serbs account for 3301 or 63.2%, Montenegrins 573 or 11%, Albanians 504 or 9.6%, Muslims 240 or 4.6%, all other 479 or 9.2%, Croats 94 or 1.8%, and Macedonians 31 or 0.6%. Therefore, only the Slovenes have a negative value of-5 in these migrations. The study of the balance of migration for Kosovo and Metohia will be! confined only to the analysis of the movements with the republics other than Serbia because the relations with Central Serbia and Vojvodina can be gathered from the above considerations. Thus, the balance of migration with other republics is negative and it amounts to -14,782; Macedonia has the highest share of-8179 or -55.3%, then Croatia with -5114 or -34.6%; Bosnia and Herzegovina and Slovenia also have negative balances, while Montenegro has a positive balance of 852. The Albanians are at the top of the list of losses -6367, they most intensely move out to Macedonia (-4452), then to Croatia (-1301), and to Slovenia (-614). The total balance of migration with Montenegro is positive, 852, but it has been derived from strikingly disproportional movements of the ethnonational groups. Thus, in the net loss of-3119, the Montenegrins prevail with -2056, Serbs with -434, and "all other" with -574. Absolute losses are also characteristic of the Croats, Macedonians, Slovenes, and Hungarians. On the other hand, the relatively high gain in favour of Montenegro can be found among the Muslims 2585 and Albanians 1386. The net loss with Bosnia and Herzegovina is shared by all the ethnonational groups except for the Albanians while the net loss with Croatia (-5114) is characteristic of all the nationalities, the highest share being ascribed to the Croats with -1793 or -35.1% and Albanians with -1301 or -25.4%. Kosovo and Metohia has a relatively high loss with Macedonia which is -8179 and it involves all the ethnonational groups, but the Albanians predominate with -4452 or -54.4% and the Serbs with -1911 or -23.4%. Finally, Kosovo and Metohia has a net loss in the balance of migration with Slovenia of-1870. The migrating trend in this southern Region towards Slovenia is identical to that towards Croatia and Macedonia, while its net loss with Bosnia and Herzegovina is the result of the net loss on the part of all the ethnonational groups except for the Albanians.
*** On the basis of the above data it can be concluded that the ethnic factor lies in the background of varying reproductive behaviours of certain ethnonational groups in the Republic of Serbia. At the same time, this factor causes the nationally homogeneous migrations in specific political and civilisation circumstances. The relation between these two components causes a major difference in the demographic growth of peoples and national minorities, which then causes considerable changes on the ethnographic map of Serbia. Thus, in the period after World War II and particularly in the sixties, the national structure of the Republic of Serbia changed so much that the shares of Serbs, Montenegrins, Croats, and Hungarians in the total population decreased, while the Albanians rapidly grew in number. The growing share of the Muslims, who have a marked tendency towards natality reduction, is mainly due to the long lasting decrease in the reproduction of the Serbs and others in Central Serbia and Vojvodina except Albanians and Romanies. Thus, the Serbian, Croatian and Hungarian populations in Vojvodina experienced biological depopulation and the Serbian population in Central Serbia is about to experience the same. The only exception are the Serbs and Montenegrins in Kosovo & Metohia that still maintain the natural increase rate of about 10%o in spite of mass migrations and exodus. With regard to the long term character of demographic processes, the national structure of the Republic of Serbia will be exposed to the prevailing influence of differential natural increase and ethnically homogeneous migratory trends in the near future. The shares of Albanians and Muslims in the national structure of the total population in Serbia will increase. Ethnically homogeneous movements are mostly related to the Serbs and Croats migrating towards their homelands and countries, while the migratory behaviour of the Montenegrins, Macedonians, and Muslims will greatly depend upon political and economic stability. From this aspect, the ethnodemographic processes in Serbia offer a rather gloomy picture which cannot be changed in the circumstances of critical political, international, economic, and social conditions and relations. There are indications that the years of 1988 and 1989 were the threshold for the demographic development of the Serbian population, rather for the rapid and widely spread biological depopulation, which already occurred among the Croats and Hungarians in Vojvodina. It is very difficult to distinguish the impact of psychological and sociological effects from real economic factors, but it is a fact that their interaction caused incredible depreciation in the recent demographic history of the Serbian people. NOTES 1. Stanovništvo Narodne Republike Srbije od 1834-1953 /Population of Serbia.../ (Belgrade: Zavod za statistiku i evidenciju NRS, 1953), 1,4. 2. Milica Sentić, "Stanovništvo i populacioni gubici ustaničke Srbije," /Population and Losses... in Serbia/ in Prilozi statističkom izučavanju Prvog srpskog ustanka, 14 (Belgrade: Zavod za statistiku NR Srbije, 1955), pp. 17-26. 3. Vladimir Jakschitch, ed., Statistique de Serbie (Belgrade, 1855), p.23. 4. Milovan Radovanović, "Antropogeografske i demografske osnove razvoja naseljenosti u Srbiji," /Anthropogeographical and Demographic Elements of Population Density in Serbia/ in Zbornik radova Geografskog instituta "Jovan Cvijić", 4.3 (Belgrade: SANU, 1991), p. 75. 5. Stanovništvo..., op. cit., p.5. 6. Vladimir Stipetić, "Stanovništvo uže Srbije u 19. vijeku i I srpski ustanak," /Population of Serbia Proper.../ in G/as SANU, Odeljenje društvenih nauka, 19 (Belgrade, 1975), CCXCIV. 7. Jakschitch, op. cit., p. 28. 8. Ibid., p.22. 9. Državopis Srbije /Population Census/, IX, 150-153. 10. Dušan Breznik et. al., Demografski razvitak nacionalnosti u Srbiji /Demographic Growth of Nationality in Serbia/ (Belgrade: Institut društvenih nauka, 1967), p.18. 11. Milovan Radovanović, "Glavne karakteristike demografskog razvitka SR Srbije," /Main Characteristics of Demographic Growth of Serbia! in Zbornik SR Srbije, 1 (Belgrade: Književne novine, 1982),p. l53. 12. Jovan Cvijić, Balkansko poluostrvo i južnoslovenske zemlje /Balkan Peninsula and South Slav Countries/ (Belgrade: Zavod za izdavanje udžbenika, 1966), pp. 151-152. 13 Ibid. 14. Radovanović, "Antropogeografske ...," p.78. 15. By the clauses of the 1919 Treaty of Neuilly the following districts were attached to Serbia: Caribrod (Dimitrovgrad), Bosilegrad and the so-called "additions" to Krajina, to Timok and the so-called "transitional addition." 16. Radovanović, "Antropogeografske...," pp. 80-81. 17. Stanovništvo..., op. cit., pp. 17-26. 18. Prethodni rezultati popisa stanovništva u Kraljevini Srba, Hrvata i Slovenaca 31. januar 1921. /Preliminary Census Reports.../ (Sarajevo, 1924), Intro. xxi. 19. Ibid. 20. Miloš Macura, Stanovništvo kao činilac privrednog razvoja Jugoslavije /Population as a Factor of Economic Development in Yugoslavia/ Ekonomska biblioteka, 7 (Belgrade, 1958), p.10. 21. Radovanović, "Antropogeografske ...," p.82. 22. Živojin Kržalić, "Stanovništvo Jugoslavije 1921. godine po veroispovesti i maternjem jeziku," /Population of Yugoslavia by Religion and Mother Tongue.../ in Radni dokument, 32, (Belgrade: RZS SR Srbije, 1986). 23. "Stanovništvo po narodnosti," /Population by Nationality/ in Konačni rezultati popisa stanovništva od l5. marta 1948. IX (Belgrade: Zavod za statistiku NRS), Intro. xvii. 24. "Stanovništvo prema nacionalnom sastavu u Republici Srbiji," /Population by Nationality in SR Serbia/ in Saopštenje, 282 (Belgrade: RZS SR Srbije, 1991). 25. Dubravka Velat, "Stanovništvo Jugoslavije u posleratnom periodu," /Population in the Post-War Yugoslavia/ in Studije, analize i prikazi Saveznog zavoda za statistiku, 123 (Belgrade: SZS, 1988). 26. Prvi rezultati popisa stanovništva, domaćinstava, stanova i poljoprivrednih gazdinstvima 1991. /First Results of the Population Census .../ (Belgrade: RZS SR Srbije, 1991). 27. Miroslav Lalović, "Mogućnosti istraživanja migracija iz popisa stanovništva," /Research of Migrations.../ in Statističar; 10 (Belgrade, 1982), p.1. Svetlana Radovanović, M. A. is Research Associate in the Center of Demographic Research, Institute of Social Sciences, Belgrade. Her major area of research is demography, population statistics, ethnodemography, ethnogeography. She has published about thirty papers and contributions to monographs. The major titles are: Prirodno kretanje stanovništva Srbije bez Pokrajina /Natural Migrations of the Population of Serbia Without its Provinces) (1985); doseljavanje Srba i Crnogoraca sa Kosova u Centralnu Srbiju /Immigration of the Serbs and Montenegrins from Kosovo into Central Serbia/ (1985); Promene u ukupnom stanovništvu i nacionalnoj strukturi pograničnih opština SAP Kosovo/Changes in the Total Population and in the National Structure of the Bordering Municipalities in the Kosovo Region/ (1987); Aktuelna demografska situacija - prikaz osnovnih podataka o stanovništvu opštine Štrpce prema vanrednom popisu 1989 /The Population of the Štrpce Municipality according to the 1989 Interim Census/(1990); Etnička struktura stanovništva Srbije /The ethnic Structure of the Population of Serbia/(1993); Ekonomske migracije stanovništva Sredačke župe /Economic Migrations of the Population of Sredačka župa/ (1995); Etnička struktura Maternji jezik i veroispovest stanovništva SR Jugoslavije /Ethnic Structure, Mother Tongue and Confession of the Population m the FR of Yugoslavia) (1995); Etnička struktura stanovništva Srbije i demografske karakteristike većih etničkih grupa /Ethnic Structure of the Population of Serbia and the Demographic Characteristics of the Major Ethnic Groups) (1995). // Projekat Rastko / Istorija // | ||||||||||||||||||||||||||||||||||||||||||||||||||||||||||||||||||||||||||||||||||||||||||||||||||||||||||||||||||||||||||||||||||||||||||||||||||||||||||||||||||||||||||||||||||||||||||||||||||||||||||||||||||||||||||||||||||||||||||||||||||||||||||||||||||||||||||||||||||||||||||||||||||||||||||||||||||||||||